Figure 6.
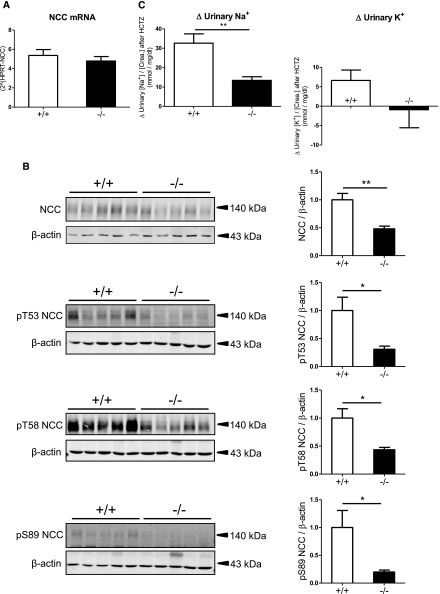
Transcription, expression, phosphorylation, and activity of the thiazide-sensitive NCC in kidneys of AS+/+ and AS−/− mice kept on a 2% K+ diet for 48 hours. (A) NCC mRNA levels are assessed by real-time RT-PCR. n=7 mice per group. (B) Detection of total NCC and NCC phosphorylated at threonine 53 (pT53 NCC), threonine 58 (pT58 NCC), and serine 89 (pS89 NCC) by immunoblotting using total membrane fractions of whole kidney homogenates. Data are normalized against β-actin. Bar graphs represent densitometric data. n=5 mice per group. (C) Difference (Δ) in urine [Na+]/[creatinine] and [K+]/[creatinine] ratios between vehicle-injected (DMSO) mice and hydrochlorothiazide-injected (HCTZ) mice. Vehicle and HCTZ are injected intraperitoneally at 48 hours after starting the feeding experiment. Urine is collected for the following 4 hours. n=8–9 for in each group. Values are the mean±SEM. *P≤0.05; **P≤0.01.

