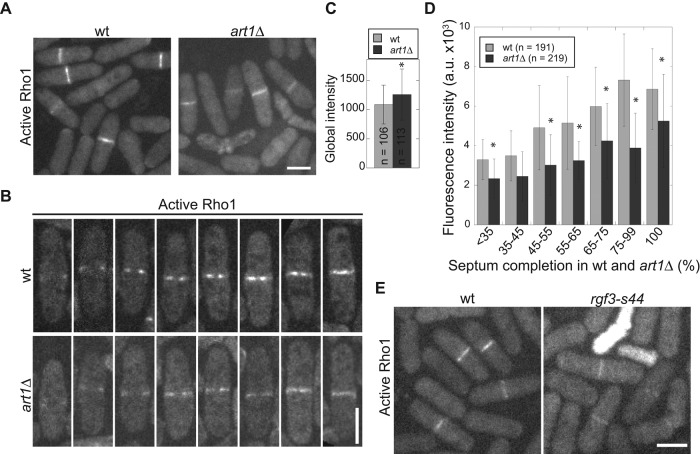
FIGURE 6:
Active Rho1 GTPase at the division site is reduced in art1∆ cells. (A–D) Micrographs (A and B) and quantifications (C and D) of active Rho1 using biosensor Pkc1(HR-C2)-mECitrine in wt (JW5593) and art1∆ (JW5877) cells. Cells were grown in YE5S liquid medium for 48 h before imaging. (B) Representative cells quantified in D. (C) The global intensity of the Rho1 biosensor in wt and art1∆ cells. *, p < 0.05 in t test. (D) Rho1 biosensor intensity at the division site during septal formation in wt and art1∆ cells. Septal growth was measured as percentage completed septa over cell width. *, p ≤ 0.05. (E) Localization of the Rho1 biosensor in wt (JW5593) and rgf3-s44 mutant (JW6165). Cells were grown in YE5S + 1.2 M sorbitol medium due to the severe lysis of rgf3-s44. Scale bars: 5 μm.

