FIGURE 1:
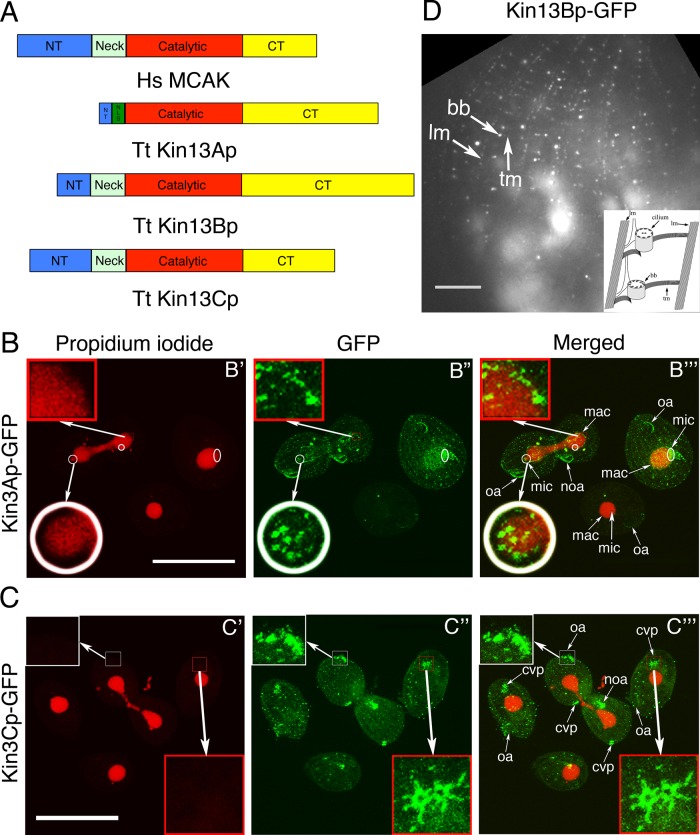
Tetrahymena expresses three homologues of kinesin-13, each with a distinct pattern of localization. (A) A comparison of predicted domain organizations of the well-studied human kinesin-13 (MCAK) and homologues of T. thermophila. CT, C-terminal domain; NT, N-terminal domain; NLS, nuclear localization signal (predicted using cNLS mapper). (B, C) Confocal immunofluorescence images of cells in which either Kin13Ap or Kin13Cp is tagged with a C-terminal GFP expressed in the native locus. The cells show a direct kinesin-13–GFP signal (green) and nuclear DNA stained with propidium iodide (red). (B) Kin13Ap localizes to the nuclei when they divide. The cells on the left and right are in an advanced (left) or early (right) stage of cell division, respectively, whereas the middle bottom cell is in interphase. In the cell on the left, the macronucleus undergoes amitosis, whereas the micronucleus is in the telophase of mitosis. The insets show a higher magnification of the micronucleus (white circle) and the macronucleus (red box) in the boxed area. In the cell on the right, the micronucleus is in early anaphase. The white circles and oval in B′ mark the micronuclei in mitosis. The two dividing cells have weak green dots in the cell cortex, which are likely the somatic and oral basal bodies. Bar, 50 μm. (C) Kin13Cp associates with cortical microtubules and cilia. The images show a dividing cell that is surrounded by three interphase cells. All cells show weak dots of cortical labeling consistent with basal bodies. Both dividing and two of the three nondividing cells show a strong CVP signal (red box). The dividing cell shows a very strong signal in the growing cilia of oral apparatuses (the anterior one is magnified in the white box) in both the anterior and posterior daughter cells. Bar, 50 μm. (D) TIRF image of a cell with a natively tagged Kin13Bp-GFP that is detected near the basal bodies and cortical microtubules (transverse and longitudinal). The structures are identified based on their shape and relative locations. The schematic organization of the cell cortex microtubules viewed from the ventral side is shown in the right bottom corner (modified from Sharma et al., 2007). Bar, 20 μm. bb, basal body; cvp, contractile vacuole pore; lm, longitudinal microtubule; mac, macronucleus; mic, micronucleus; noa, new oral apparatus; oa, oral apparatus; tm, transverse microtubule.

