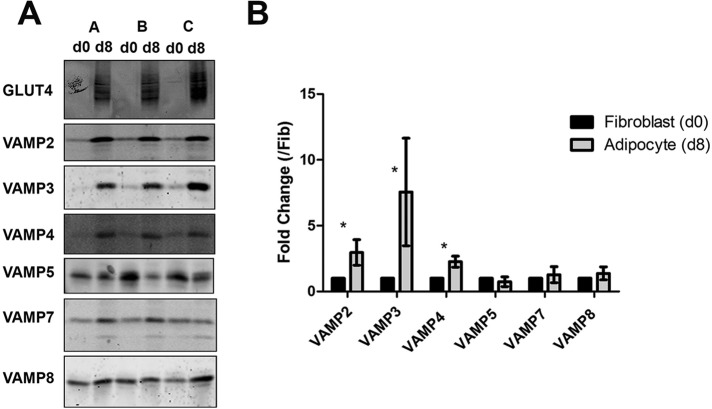
FIGURE 2:
Selective VAMP isoforms are up-regulated during differentiation of 3T3-L1 adipocytes. (A) Equal numbers of fibroblast and adipocyte cells, quantified using propidium iodide staining of nuclei, were homogenized and subjected to centrifugation at 95,000 × g for 1 h to pellet to the total membranes as described. Samples representing equal numbers of cells from day 0 (fibroblasts; d0) or day 8 (adipocytes; d8) were then subjected to SDS–PAGE, followed by immunoblotting with anti-GLUT4 and anti-VAMP antibodies as indicated. Three batches of membranes are displayed on each gel (A–C); d0, fibroblast. (B) The changes in VAMP levels upon differentiation were quantified. Values represent the means of three separate experiments in which fold changes compared with fibroblasts are shown for each VAMP member; values were compared using Student's t test, *p < 0.05.

