
FIGURE 4:
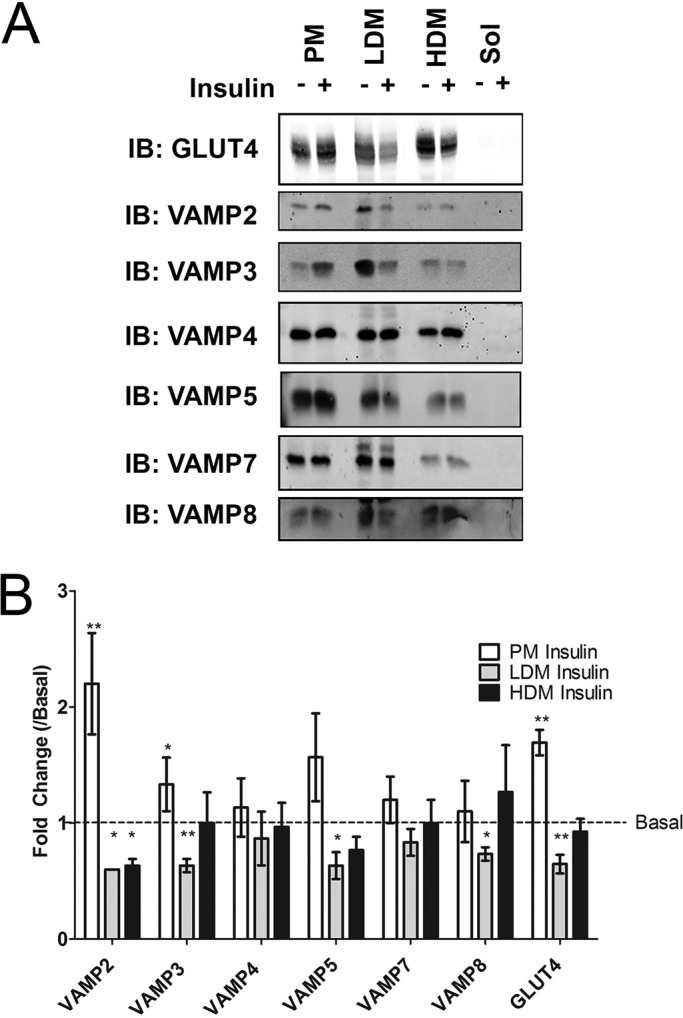
Subcellular distribution of VAMP isoforms in basal and insulin-treated adipocytes. 3T3 L1 adipocytes were treated with (+) or without (–) 1 μM insulin for 20 min. Subcellular fractionation was performed as described generating PM, LDM, HDM, and soluble fractions (Sol; see also Supplemental Figure S1). Fractions were resuspended in equal volumes of 1× LSB and subjected to SDS–PAGE and immunoblotting with the indicated antibodies. (A) Representative immunoblots, in each case repeated with a minimum of three separate platings of cells. (B) Quantification of the changes in the distribution of each VAMP isoform in each fraction in response to insulin expressed relative to the basal levels in each fraction. Values represent means ± SD of three separate experiments; fold change compared with basal values were compared using Student's t test, *p < 0.05, **p < 0.01.