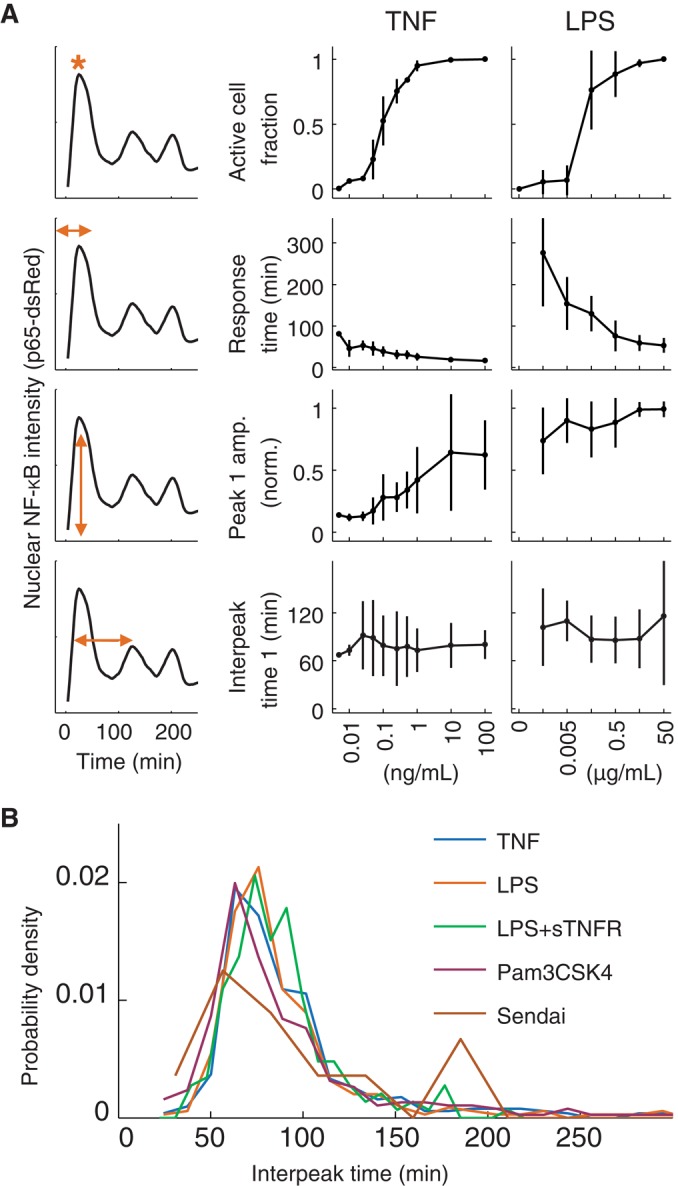
FIGURE 1:

The time between p65-dsRed nuclear localization peaks is constant across stimuli and concentration. (A) The fraction of active cells (top row), as well as the time to (second row) and amplitude of (third row) the first peak, vary, depending on stimulus and concentration, whereas the time between the first and second peaks (bottom row) is constant. (B) Distributions of all interpeak times for five different environmental conditions: TNF and LPS (concentrations as shown in A), LPS (concentrations as shown in A), together with soluble TNF receptor II (sTNFR; 5 μg/ml), Pam3CSK4 (1 μg/ml), and Sendai virus (10 and 100 U/ml). See also Supplemental Figure S1.
