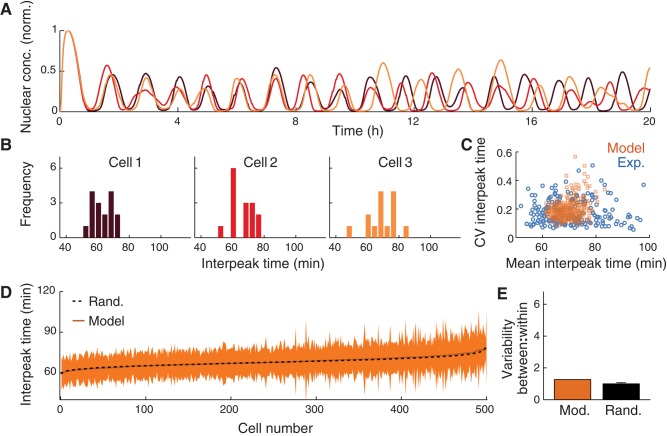
FIGURE 3:
Computational modeling captures variability within, but not between, cells. (A) Three model simulations of p65 nuclear localization. (B) Interpeak time distributions of three model simulations. (C) CV vs. mean interpeak time for each simulation (orange) and for each experimentally observed cell (blue). Ratio of variability between cells to variability within all simulations, as determined using bootstrap analysis. (D) Mean and SDs of interpeak time for each individual simulation, plotted together with the distribution that would be expected without any intercellular variability (black). (E) Ratio of variance between simulations to variance within all simulations (F statistic), as determined using bootstrap analysis, on the same scale as Figure 2F.

