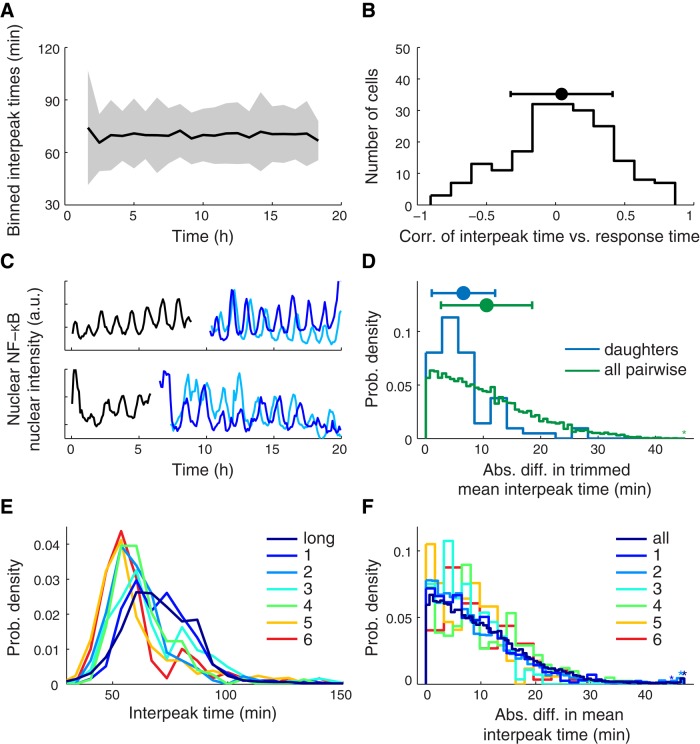
FIGURE 4:
Analysis of the time scale on which the period changes. (A) For every 50-min interval from 100 to 1100 min after TNF stimulation, the mean (black) and SD (gray) of all observed interpeak times whose left peak occurs in that interval. (B) Distribution, along with mean and SD, of the Spearman rank correlation of interpeak time with time for every cell. (C) Two examples of cell division that occurred during TNF stimulation: mother cell (black) and two daughter cells (light and dark blue). (D) Distribution of absolute difference in mean interpeak time between two daughter cells with the same mother and between any two daughter cells. (E) Distribution of interpeak times, in response to 10 ng/ml TNF stimulation, for each clonal cell line. (F) Same calculation as in D. Distribution of all pairwise comparisons of mean interpeak time within cells of a clone compared with the distribution of all pairwise comparisons across cells of any clone. See also Supplemental Figure S2.

