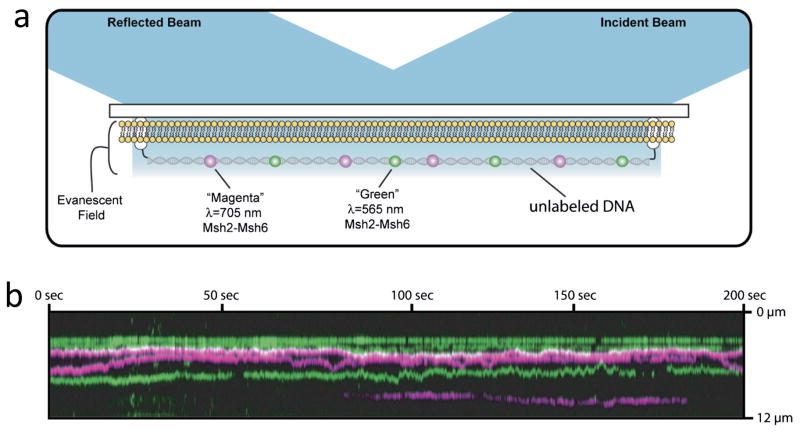
Figure 2.
Single molecule tracking experiments. a) Schematic of the experimental approach. DNA is tethered to a surface at the ends. The intervening surface is passivated in this example by a lipid bilayer. Fluorescent dye-labeled MMR proteins are shown diffusing on the DNA. The surface is illuminated by total internal reflection. b) Kymograph representation of single particle tracking of protein diffusion on DNA. The vertical direction represents position along one molecule of DNA that is extended and tethered to the surface. The horizontal direction is time during an experimental imaging experiment. The individual colored lines are the location of diffraction limited fluorescence spots from single proteins. Horizontal lines represent position vs. time of proteins along the DNA. Motion of a protein along the DNA appears as vertical changes in the line as time advances from left to right. Note, some molecules bind or unbind the DNA during the observation, indicated by colored lines that begin or end abruptly as they are tracked horizontally across the image. Adapted from [60].

