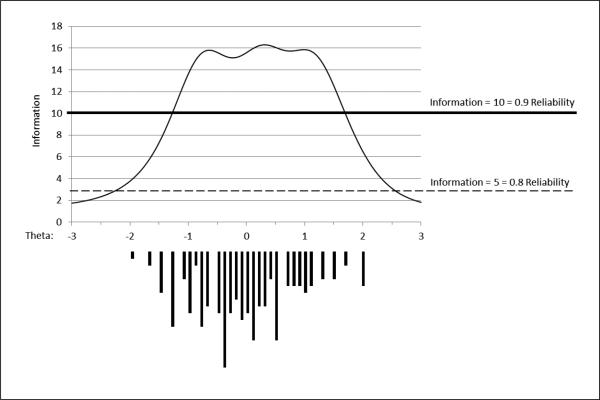
Figure 2.
Above is the IRT-based test information curve for the Sexual Compulsivity Scale. The horizontal axis displays the values of theta (the value of the latent construct) ranging from −3 to 3. The vertical axis for the upper portion of the plot displays the range of test information from 0 to 18, which indicates how precisely the test measures the latent construct (SC). For values of theta between −1.8 and 2.1, the scale measures with at least 80% reliability; for values of theta between −1.2 and 1.8, the scale measures with at least 90% reliability (corresponding to raw scores of 15 to 38). The lower portion of the plot is a histogram of sample that shows the observed distribution of scores within the sample across the continuum of sexual compulsivity; this shows that the sample had adequate variability across much of the continuum from −2.0 to 2.0.

