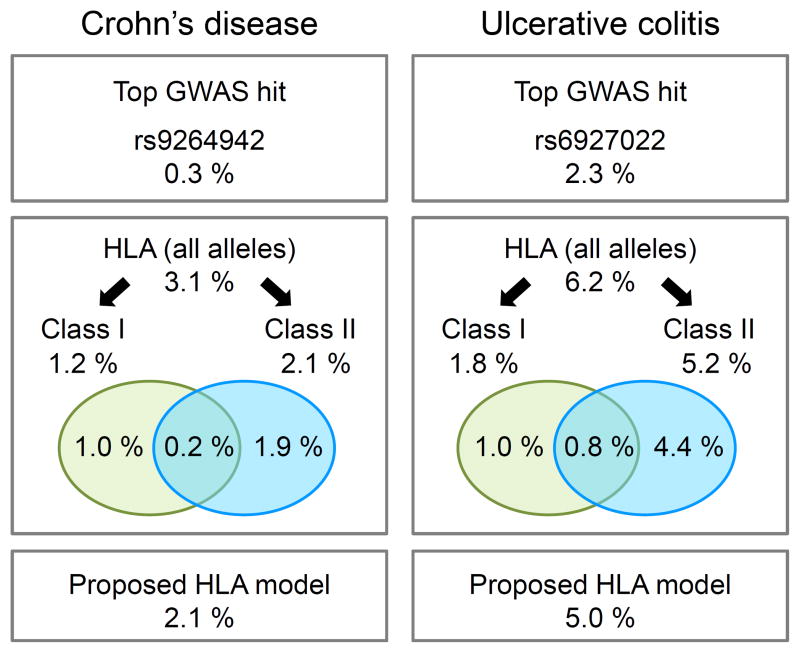
Figure 2. Variance explained by 4-digit HLA alleles in CD and UC.
Proportion of variance explained on a logit scale (McKelvey and Zavoina’s Pseudo R2, see Online Methods) for different models in CD (left) and UC (right). The top boxes show the variance explained by previously identified GWAS index SNPs within the MHC4. The middle boxes illustrate the variance explained by HLA models including all 4-digit alleles of frequency > 0.5% (126 alleles in CD and UC) and models restricted to 4-digit alleles within either class I (63 alleles) or class II regions (63 alleles), respectively. The Venn diagram illustrates the proportion of variance explained that is unique to class I, class II or shared. The bottom boxes indicate the variance explained by the proposed HLA models (15 and 16 alleles in CD and UC, respectively). To be noted, these estimations of variance explained were performed on the logit scale for practical reasons, and should not be directly compared to heritability estimates computed on the (Gaussian) liability scale.

