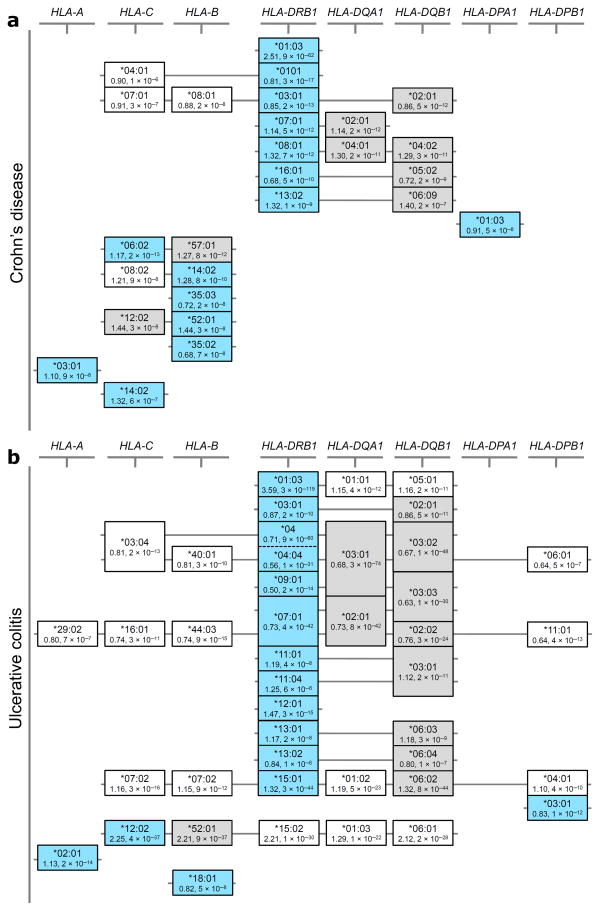
Figure 3. Correlated association signals at HLA alleles support potential alternate association models for both CD and UC.
Equivalence of effect at the different study-wide significant associated 4-digit HLA alleles is shown for (a) CD and (b) UC. The structures illustrated in the figure are not classically defined haplotype structures, but were identified entirely based on the correlation of signal defined through pairwise reciprocal conditional logistic regression analyses (see Supplementary tables 2 and 3); although such correlations are clearly dependent on the underlying haplotypic structure of the region. Alleles identified as primary tags for independent association signals in our HLA-DRB1 focused models are shown in light blue boxes, while alternate alleles with equivalent effects are shown in grey boxes. Alleles in white boxes show study-wide significant secondary effects that can be explained entirely by the selected HLA alleles. Alleles at the HLA-DRB3, -DRB4 and -DRB5 genes were omitted in order to simplify the display; many of the alleles at these genes show high frequency and as such are correlated to many different alleles (both risk and protective) at the other class II genes. Of note, the HLA-DRB4*null allele is the second strongest associated allele in UC (see Supplementary table 3).

