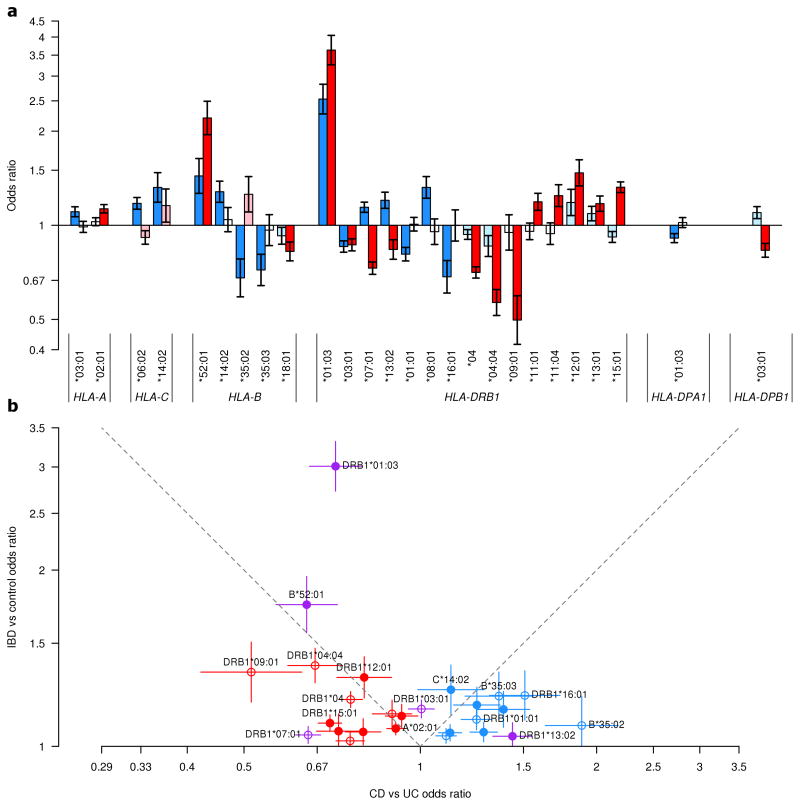
Figure 6. Comparison of odds ratio in CD and UC for HLA alleles identified from HLA-focused models.
Odds ratio (OR) from the primary univariate association analyses in CD and UC for all alleles identified in the HLA-focused models of CD and/or UC are presented with 95% confidence intervals (a). Odds ratio for CD and UC are in blue and red respectively; darker colors indicate study-wide significant effect (P<5×10⁻⁶), lighter colors indicate nominal significance level (0.05>P 5×10⁻⁶) and white indicates non-significance (P 0.05) (for specific effect and significance values refer to Fig. 3 and Supplementary Tables 2 and 3). Allele HLA-B*52:01 is indicated for UC in place of the equivalent HLA-C*12:02 to simplify the display of this shared signal. For the same HLA alleles, odds ratio (with 95% confidence intervals) for an IBD analysis are plotted against the odds ratio for the CD versus UC analysis with the IBD risk allele as the reference (b). Empty circles represent variants where the absence of the allele is the reference. Alleles identified as significant in CD or UC only are plotted in blue and red, respectively. Variants identified as significant in both are shown in purple. To be noted, HLA-DRB1*07:01 and HLA-DRB1*13:02 have opposite direction of effect between CD and UC. Shared association signals are expected to fall in the upper triangle of the plot. Most variants fall outside of this region, highlighting the difference between CD and UC in the MHC.

