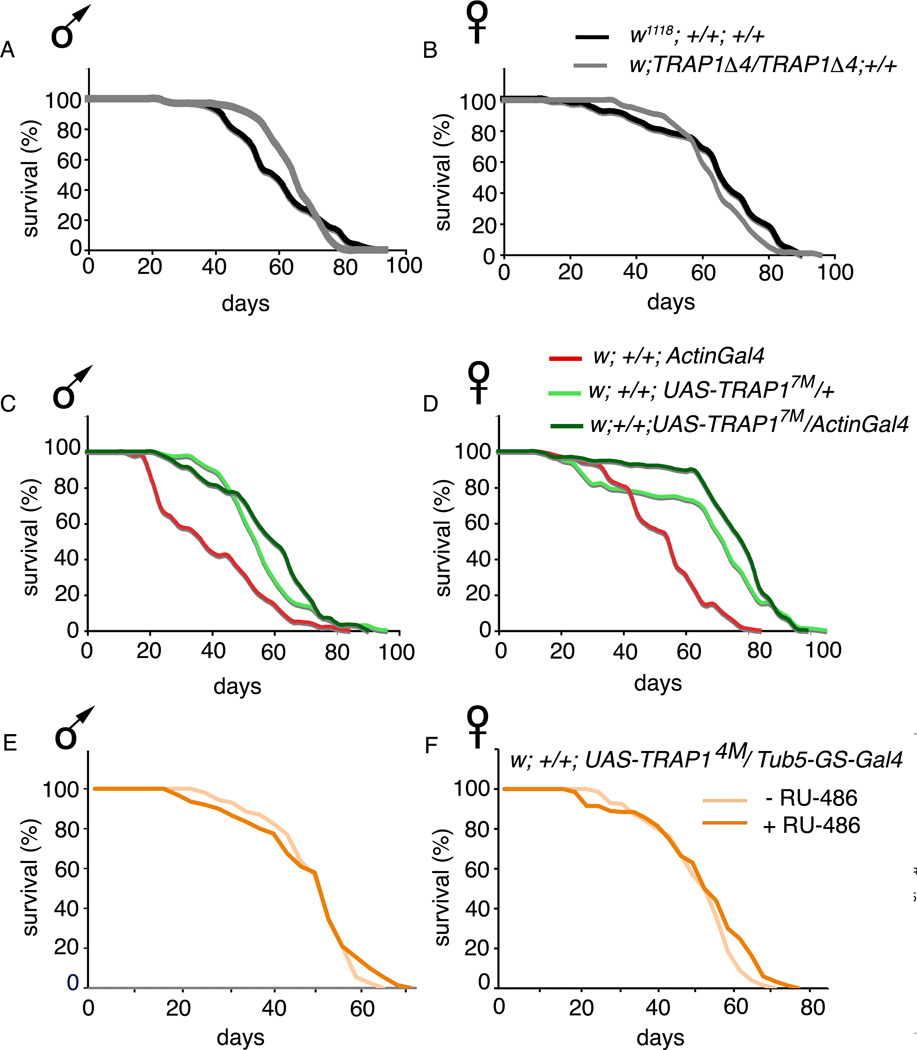
Figure 4. TRAP1 has a marginal influence on lifespan.
Lifespan curves of indicated genotypes. (A) Median lifespan of male w1118; +/+; +/+ (60.4 ± 1.4 days) is comparable to that of w; TRAP 1Δ4/TRAP 1Δ4; +/+ (64.9 ± 1.1 days; p=0.48). (B) Median lifespan of female w1118; +/+; +/+ (64.6 ± 1.44 days) is comparable to w; TRAP 1Δ4/TRAP 1Δ4; +/+ (64.32 ± 0.98 days; p=0.08). (C) Median lifespan of male w; +/+; UAS-TRAP17M/ActinGal4 (58.6 ± 1.3 days) is significantly more than w; +/+; ActinGal4/+ (40.7 ± 1.4 days; p<0.001), and marginally more than that of w; +/+; UAS-TRAP17M/ + (56.5 ± 1.1 days; p=0.05). (D) Median lifespan of female w; +/+; UAS-TRAP17M/ActinGal4 (75.5 ± 1.4 days) is significantly more than that of w; +/+; ActinGal4/+ (53.5 ± 1.2 days; p<0.001), and marginally more than that of w; +/+; UAS-TRAP17M/ + (66.5 ± 1.9; p=0.044). (E) Median lifespan of w; +/+; UAS-TRAP14M/ GS-tub5Gal4 males maintained on RU-486 (43.66 ± 0.88 days) is similar to control flies of the same genotype, sex and age maintained on vehicle (44.86 ± 0.64 days; p = 0.15). (F) Median lifespan of w; +/+; UAS-TRAP14M/ GS-tub5Gal4 females on RU-486 (47.24 ± 0.97 days) is also comparable to controls (44.84 ± 0.81 days; p=0.04). In all cases, errors denote standard deviation. Statistical significance was determined using the standard chi-squared based log-rank test.

