Figure 3.

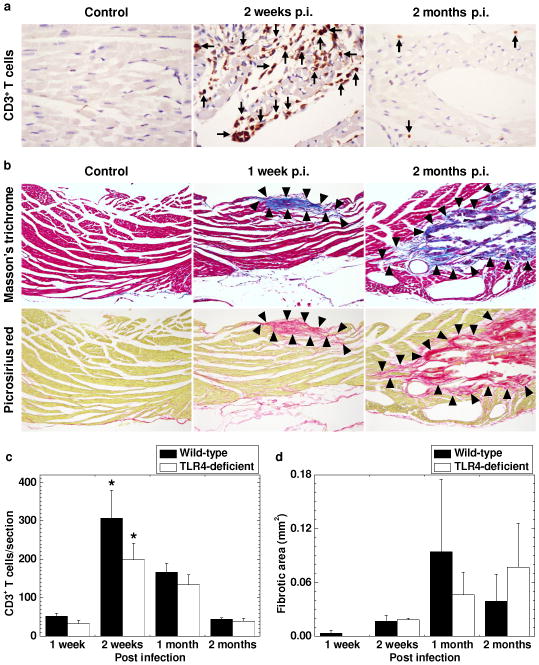
Time course studies of cardiac pathology in TMEV-infected C3H mice. C3H mice were infected with TMEV and killed 1 week, 2 weeks, 1 month, and 2 months p.i. (a) Immunohistochemistry against CD3 showed a larger number of CD3+ T cells (arrows) in the heart 2 weeks p.i. compared with 2 months p.i. No CD3+ T cells were seen in age-matched uninfected control mice. (b) Masson trichrome staining (upper panel) and picrosirius red staining (lower panel) visualized progressive cardiac fibrosis (arrowheads). (c) CD3+ T cell infiltration was detected 1 week p.i. and peaked 2 weeks p.i. (* P < 0.05 compared with the other time points, Student t test). There were no statistical differences in CD3+ T cell infiltration in the heart between wild-type and TLR4-deficeint mice. (d) Fibrotic areas were detected 1 week p.i., developed progressively, and peaked 1 and 2 months p.i. Using Image-Pro® Plus Version 6.3, the fibrotic areas were quantified by image analyses. (a, b) The heart was dissected into four transverse sections. Magnification, 185× (a) and 46× (b). The sections were representative of four independent experiments composed of 24 mice. (c, d) CD3+ T cells and fibrotic areas were quantified in the four sections per mouse. Results are mean ± SEM from six mice per time point.
