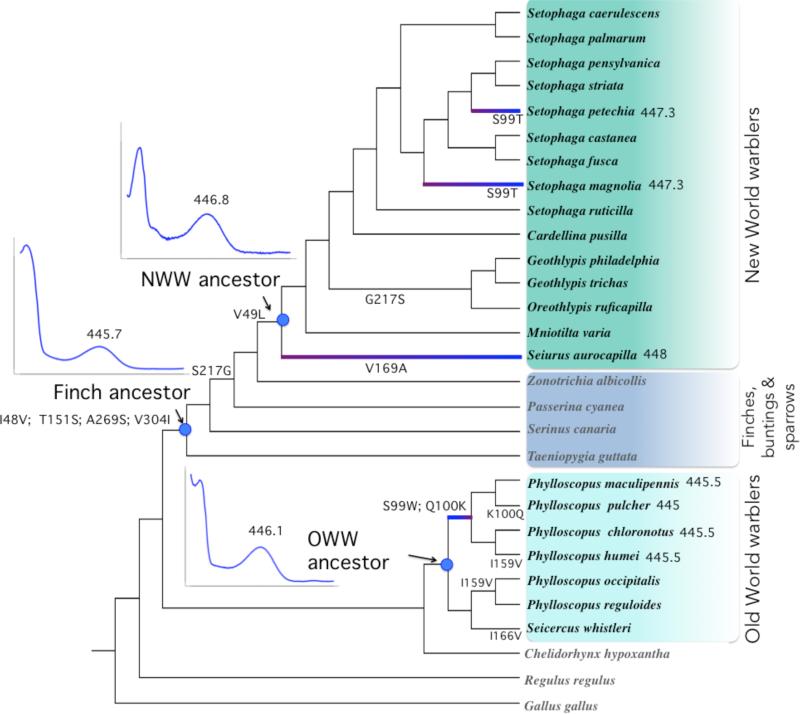
Figure 4.
Cladogram of SWS2 sequence evolution in New World warbler and Old World warbler species, with the topology from Price et al. (2014) and Lovette et al. (2010), as in Figure 1. Indents show SWS2 absorbance spectra, and their corresponding λmax value, given the inferred sequences for the ancestors of New World and Old World warblers, as well as the finch ancestor (axis scales for these graphs are the same as Fig. 5). Highlighted branches illustrate spectral shifts associated with warbler evolution, as listed in Table 1, as well as their direction. SWS2 λmax values for these branches are shown next to species names. Substitutions shown for each edge correspond to the states with the highest posterior probabilities from likelihood/Bayesian ancestral reconstructions. The deepest node in this tree has the following inferred amino acid composition at the relevant sites: I48, V49, S99, Q100, T151, I159, I166, V169, S217, A269, V304. Posterior probabilities associated with the ancestral reconstruction of amino acid sequences are shown in Fig. S2.

