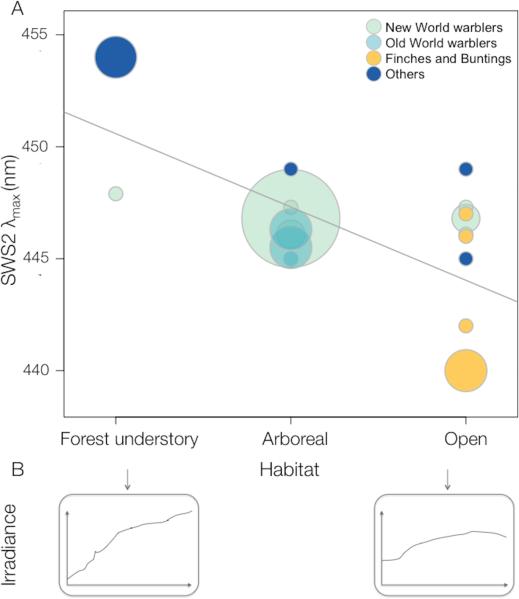
Figure 7.
Scatter plot of SWS2 λmax against habitat category in Passerine birds. Circle size corresponds to number of species and circle shade indicates the clade as detailed in the figure legend. Breeding season foraging habitat categories correspond to (1) species foraging in the forest understory, on or close to the ground, (2) all the remaining strata of the forest and (3) outside forests in the open, based on 22 warbler species from this study and 12 additional species of passerines (Table S2). The regression line, y= 450.6-3.3x, corresponds to a simple regression where habitats are given numerical values (0, 1, 2). Significance was calculated based on an ordered ANOVA where the values are considered categorical (P <0.0001, phylogenetic correction P <0.0016; details as Supplementary information). Bottom insets are irradiance spectra from 400-700nm for “small gaps” and “large gaps” respectively, taken from (Endler 1993). A cladogram illustrating the correspondence between SWS2 spectral tuning and foraging habitat is in Fig. S4.

