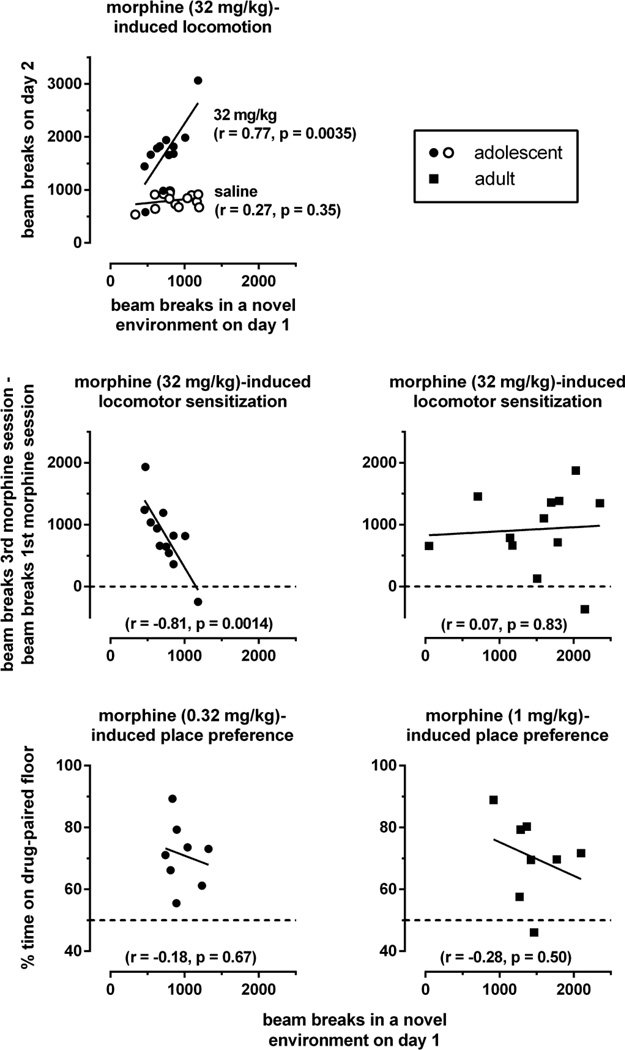
Fig. 3.
Relation between response to novelty on day 1 and morphine-induced locomotion on day 2 (upper left panel), morphine-induce sensitization of locomotion on days 2–4 (middle panels), and morphine-induced conditioned place preference on day 5 (lower panels) (experiment 1). Data points represent values obtained in individual mice, lines are best fitting regressions, and “r” is Pearson’s correlation coefficient.

