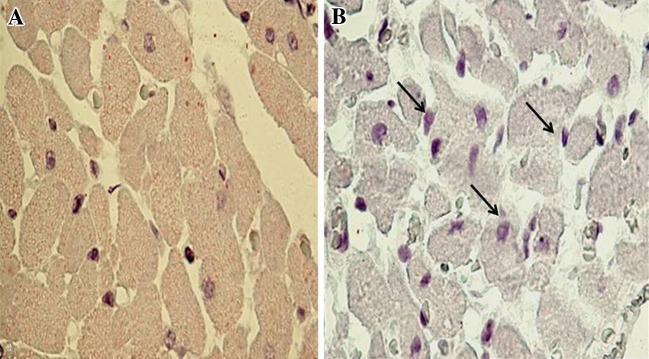
Fig. 5.

Representative photomicrographs of ventricular tissue stained for Bax protein (×400) from normal and ISP control groups. The localization of Bax protein is indicated by purple positive immunoreactivity, a healthy control rats, showing slight Bax immunoreactivity (magnification ×400) b ISP control rats, showing increased expression for Bax protein (magnification ×400)
