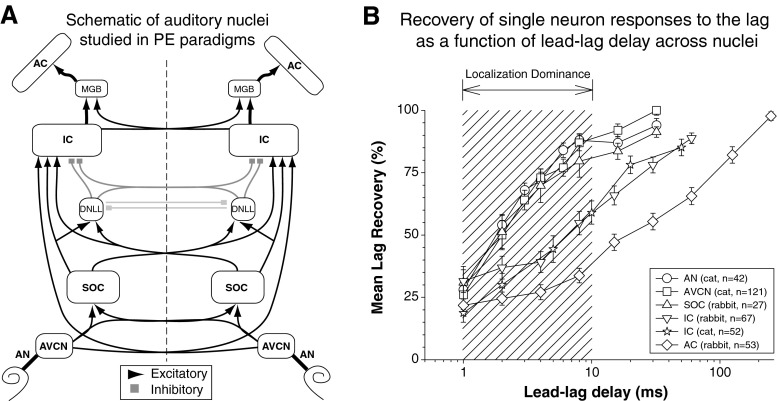
FIG. 7.
Neural responses to PE stimuli at sites along the auditory neuraxis. A Schematic diagram of the ascending auditory pathway with an emphasis on groups of neurons (nuclei) studied in physiological PE paradigms. Data for bolded nuclei (AN, AVCN, SOC, IC, AC) are given in B. Detailed anatomy (e.g., multiple nuclei and inhibitory projections within SOC) is not illustrated. B Single-neuron responses to a lagging stimulus are suppressed over a broader range of lead-lag delays at higher levels of the central auditory system. Across-neuron population lag-response recovery functions are given for structures from the auditory nerve (AN) to the auditory cortex (AC). Each data point shows the across-neuron mean proportion recovery (±1 SEM, number of neurons is indicated in legend) as a function of the lead-lag delay. A value of 100 % indicates that the response to the lag had recovered to the same level as the response to single sound presented from the lagging location. All animals were unanesthetized. There is a significant decrement in lag responses between the SOC and IC, suggestive of a primary role for IC-associated structures in some aspects of the PE (e.g., localization dominance, shaded region; see text). Data were replotted from auditory nerve (AN; Parham et al. 1996), anteroventral cochlear nucleus (AVCN; Parham et al. 1998), superior olivary complex (SOC; Fitzpatrick et al. 1995), inferior colliculus (IC; Fitzpatrick et al. 1995, rabbit; Tollin et al. 2004, cat), auditory cortex (AC; Fitzpatrick et al. 1999).

