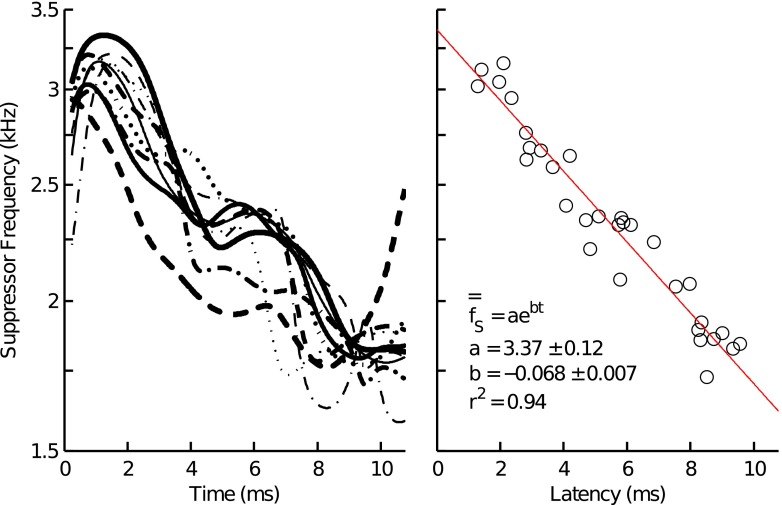
FIG. 10.
Most effective suppressor frequency of the different-latency 2 kHz TEOAE components as a function of time (left panel) and for each component (right panel). The left panel plots results from Eq. 6 for each subject (indicated by line type). The right panel plots the results from Eq. 7 for each subject (open circles) and the model fit using a 1st-order exponential function (solid line). Model parameters with 95 % confidence intervals are provided in the lower left corner of the plot.

