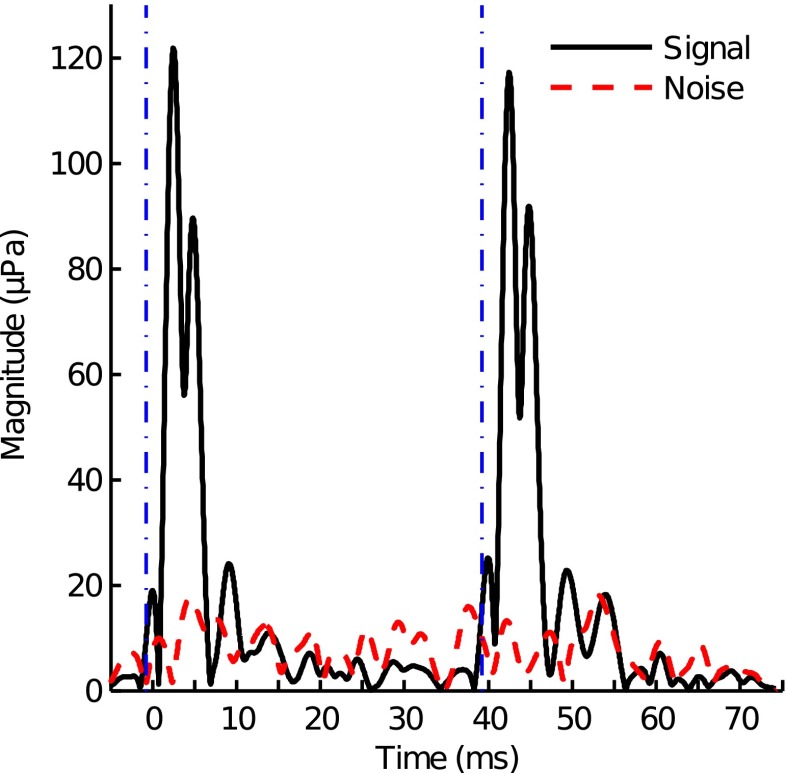
FIG. 3.
Analysis to examine potential SSOAE activity in the early portion of the TEOAE. Analysis of SSOAE activity included extending the total analysis time window to 35 ms post-stimulus onset. The portion of the time window following the longest-latency magnitude peak that occurred in the initial 10 ms post-stimulus onset was examined for non-decaying OAE energy. Such energy has the potential to contribute to the early part the of subsequent data buffer’s time window and present as a SL component. Results are shown for subject 169L. The vertical dash–dot lines indicate stimulus onset. No SSOAE activity was detected in this subject.

