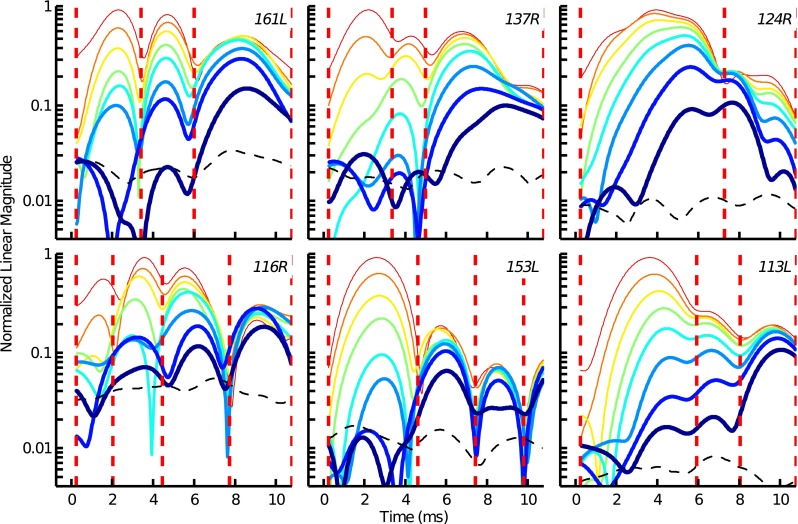
FIG. 4.

TEOAE envelopes measured for different level tone bursts in the tone-burst suppressor condition. Each panel shows data from an individual subject. Decreasing line thickness indicates increasing stimulus level (44–86 dB pSPL in 6 dB steps). The broken black line in each plot indicates the subject’s noise floor. The time windows for the different-latency components are indicated by the vertical dashed lines.
