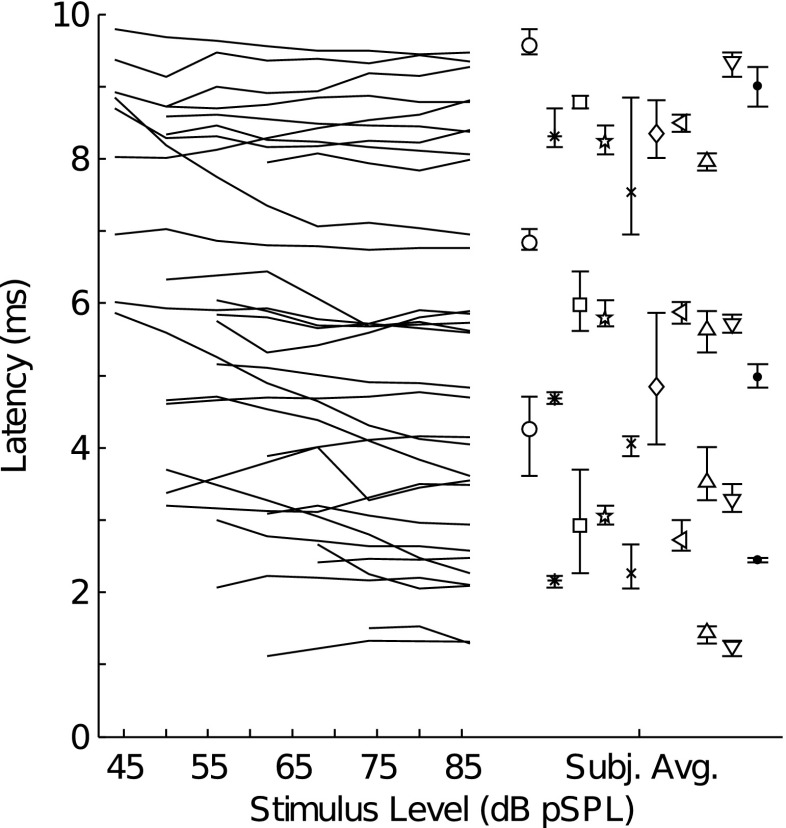
FIG. 5.
Latency-intensity functions and mean latencies of the different TEOAE components. Data represent measurements for the tone-burst suppressor condition. TEOAE-component latency is plotted as a function of stimulus level. The mean latency (averaged across stimulus level) of each component and its minimum and maximum values are indicated in the right-hand portion of the figure. Data from different subjects are indicated by marker type.

