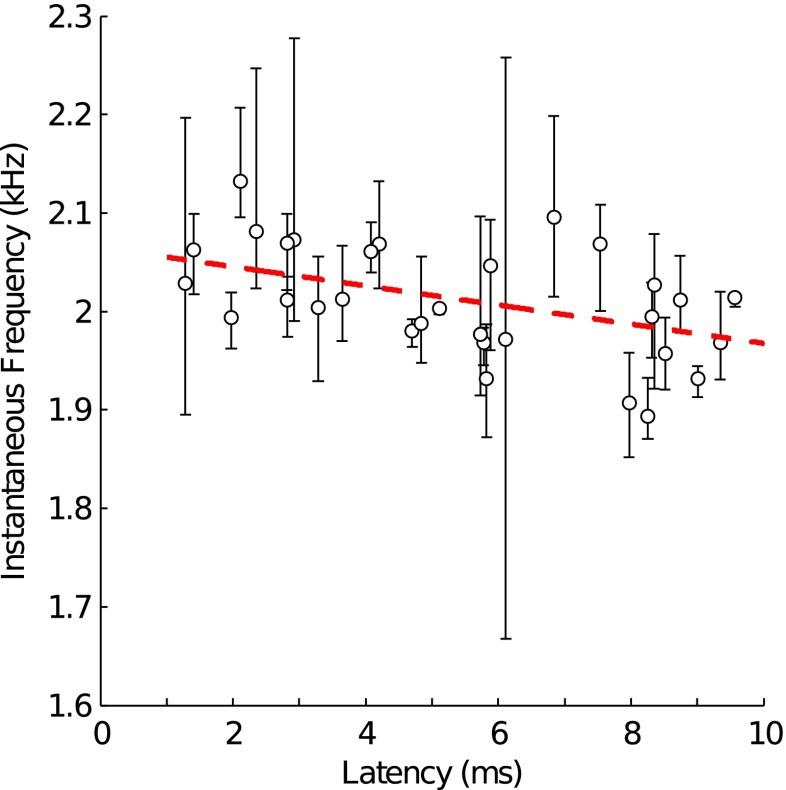
FIG. 6.
Instantaneous frequency as a function of 2 kHz TEOAE-component latency. The mean instantaneous frequency and range of each different-latency component, collapsed across subjects, are indicated by the marker and error bars, respectively. The broken red line is a 1st-order polynomial fit to the data demonstrating the trend of increasing instantaneous frequency as component latency decreases.

