
. 2015 Jan 12;12(1):125–135. doi: 10.4306/pi.2015.12.1.125
Copyright © 2015 Korean Neuropsychiatric Association
This is an Open Access article distributed under the terms of the Creative Commons Attribution Non-Commercial License (http://creativecommons.org/licenses/by-nc/3.0/) which permits unrestricted non-commercial use, distribution, and reproduction in any medium, provided the original work is properly cited.
Figure 5.
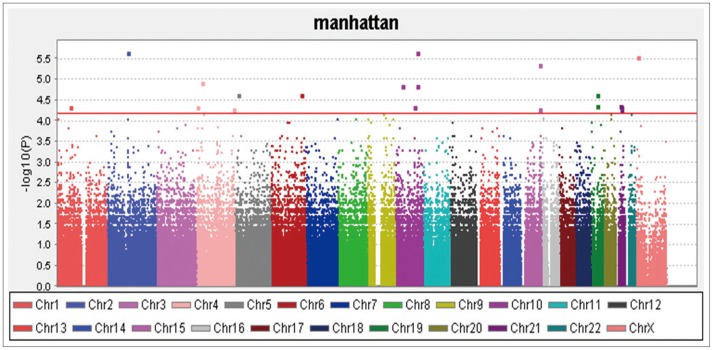
Manhattan plot for all the single nucleotide polymorphism.