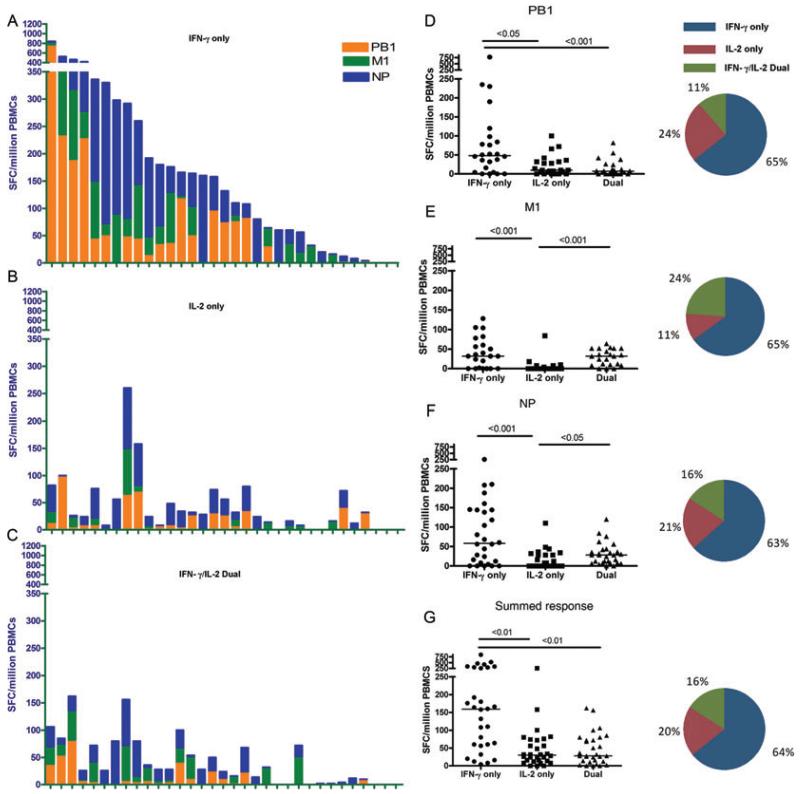
Figure 1. Pre-existing cross-reactive memory T-cell responses to pH1N1 core proteins in pH1N1 sero-negative individuals.
Total magnitude of ex vivo PBMC responses from the (A) IFN-γ-only, (B) IL-2-only, and (C) IFN-γ/IL-2 dual cytokine-secreting subsets to overlapping peptide pools of PB1, M1 and NP of pH1N1 (A/California/04/09) virus in each individual was measured by fluorescence immunospot. Individuals are shown in the same order in (A through C) (n = 33). PB1: polymerase basic protein 1, M1: matrix protein 1, NP: nucleoprotein, SFCs: spot forming cells, PBMCs: peripheral blood mononuclear cells. Haemagglutination inhibition assay was performed to confirm sero-negativity to H1 of A/England/195/09 and A/California/04/09. Magnitude of ex vivo PBMC responses from the IFN-γ only, IL-2 only and IFN-γ/IL-2 dual-secreting subsets to overlapping peptide pools of (D) PB1, (E)M1, (F) NP, and (G) the summed response to PB1, M1 and NP of pH1N1 (A/California/04/09) virus. Each symbol represents a single individual and horizontal lines represent the median response. Differences between subset responses were estimated by Kruskall-Wallis test. Pie charts represent mean proportions of cytokine-secreting responses. Non-responders to antigens excluded, PB1: n = 24, M1: n = 21, NP: n = 28, All antigens: n = 30.

