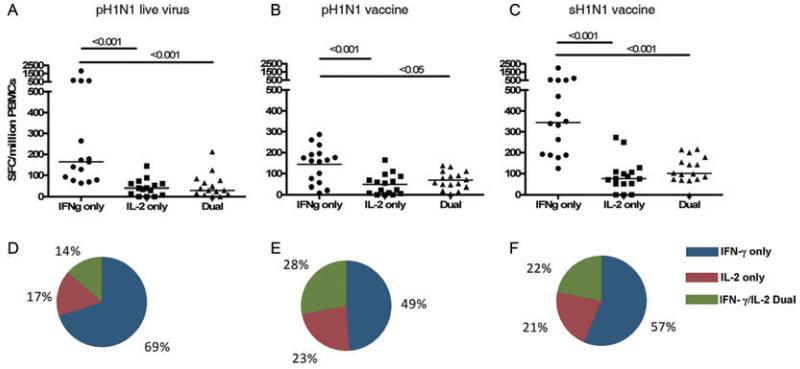
Figure 3. Cross-reactive memory T-cell responses to naturally processed pH1N1 epitopes.
The magnitude of ex vivo PBMC responses from the IFN-γ only, IL-2 only, and IFN-γ/IL-2 dual cytokine-secreting subsets to (A) pH1N1 live virus (A/England/195/2009), (B) pH1N1 vaccine strain (A/California/07/09, NYMCX-179A) and (C) sH1N1 vaccine strain (A/Brisbane/10/2007, IVR-148) in pH1N1 sero-negative individuals was determined by fluorescence immunospot. Each symbol represents a single individual and horizontal lines represent medians. Pie charts represent mean proportions of cytokine-secreting responses to (D) pH1N1 vaccine strain, (E) pH1N1 live virus and (F) sH1N1 vaccine strain. Differences between subset responses were estimated by Kruskall-Wallis test. Non-responders to stimulation excluded, pH1N1 vaccine n = 16, pH1N1 live virus n = 15, sH1N1 vaccine = 16.

