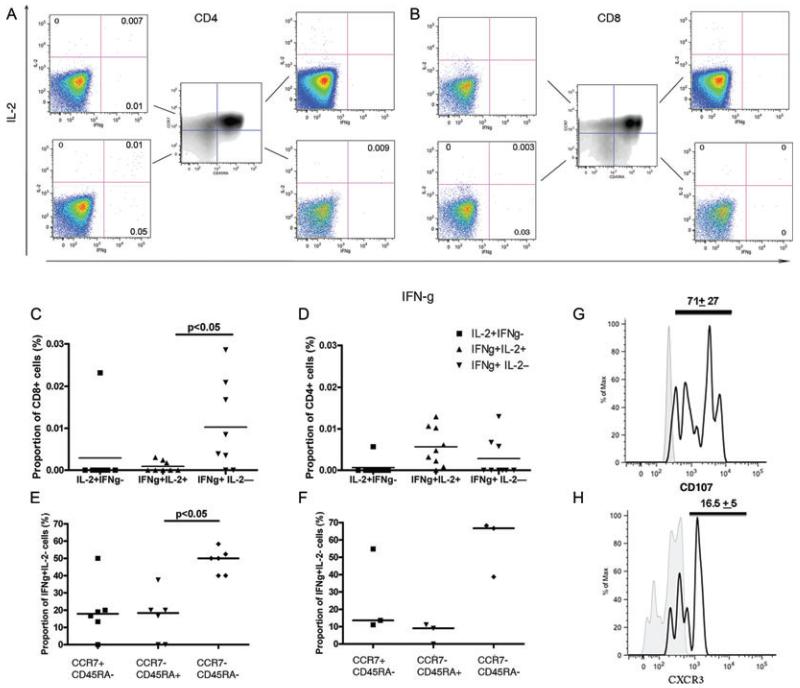
Figure 4. pH1N1-specific cross-reactive memory IFN-γ+IL-2− CD4+ and CD8+ T cells are predominantly effector memory.
PBMCs stimulated with live pH1N1 virus or allantoic fluid (unstimulated) for 16 h were stained for surface markers of memory and intracellular cytokines. PBMCs were gated on live, single cells, lymphocytes, CD3+, CD4+ or CD8+. The frequency of IL-2 and IFN-γ secreting cells was analysed separately for CD4+ and CD8+ cells in each pH1N1 sero-negative donor. (A-B) A representative example from one pH1N1 sero-negative donor stimulated with pH1N1 live virus (A/England/195/2009) is shown. Gates for CD45RA and CCR7 were identified from FMO control samples. PBMCs were gated on (A) CD3+CD4+CD8− or (B) CD3+CD4−CD8+ lymphocytes, cells stained for CD45RA and CCR7 in each quadrant are shown in central plot. Frequency of IFN-γ and IL-2 secretion for the different memory subsets based on CD45RA and CCR7 expression is shown. Number in the plot represents the frequency of cytokine-secreting cells in the stimulated sample minus the negative control sample. (C-D) Frequency of IFN-γ and IL-2 secretion for each cytokine subset for (C) CD8+ and (D) CD4+ cells in 12 individuals is shown. Individual responses are represented by symbols and horizontal lines represent median responses. Differences between groups were analysed by Kruskall-Wallis test accounting for multiple comparisons. (E-F) Proportion of (E) CD8+ and (F) CD4+ IFN-γ+IL-2− T cells that were effector memory (CCR7−CD45RA−), effector (CCR7−CD45RA+) and central memory (CCR7+CD45RA−) phenotype was determined by flow cytometry. Responses for individuals with a positive IFN-γ+IL-2− CD8+ (six individuals) and CD4+ (three individuals) T-cell response (C and D) are represented by symbols and horizontal lines represent median responses. Differences between groups were analysed by Kruskall-Wallis test accounting for multiple comparisons. (G) Expression of CD107 on CD8+ IFN-γ-only-secreting T cells. Histogram shows the staining of CD107 on stimulated cells (black line histogram) compared to unstimulated (grey-filled histogram) for one sample representative of 12 individuals. The number represents the average proportion and standard deviation of CD107+ cells from 11 individuals. (H) Representative example of expression of lung trafficking receptor CXCR3 on CD8+ IFN-γ-only-secreting cells stimulated with live pH1N1 virus. Histogram shows the staining of CXCR3 on stimulated cells (black line histogram) compared to fluorescence minus one control (grey-filled histogram). Number at the top of the histogram represents the average proportion and standard deviation of CD8+ IFN-γ-only-secreting cells that are CXCR3+. Example shown is representative of four individuals.

