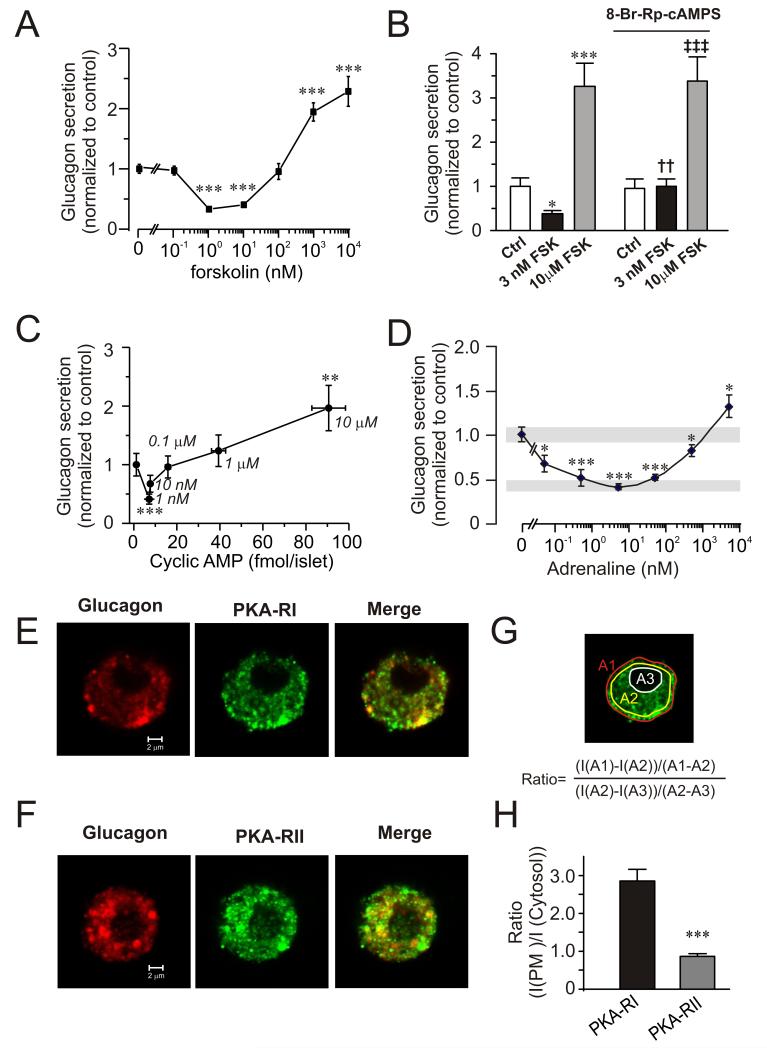
Figure 2.
Concentration-dependent effects of forskolin and adrenaline on glucagon secretion and cAMP production.
(A) Effects of increasing concentrations of forskolin (0-10 μM) on glucagon secretion at 0 mM glucose. Data have been normalized to control (13.0±0.9 pg/islet/h; n=8). ***p<0.001 vs. rate of secretion in the absence of forskolin.
(B) Glucagon secretion at 1 mM glucose (Ctrl) with or without addition of 3 nM or 10 μM forskolin (FSK) in the absence (left) and presence (right) of 10 μM 8-Br-Rp-cAMPS. Data have been normalized to control (7.1±0.3 pg/islet/h; n=6-12).*p<0.05 and ***p<0.001 vs. Ctrl; ††p<0.01 and ‡‡‡p<0.001 vs Ctrl in the presence of 8-Br-Rp-cAMPS.
(C) Glucagon secretion with increasing concentrations of cAMP. Glucagon and cAMP content were measured in islets exposed to increasing concentrations of forskolin (0-10 μM; concentrations (in μM) are given next to the data points) in the presence of 1 mM glucose. Data have been normalized to control (2.8±0.5 pg/islet/h; n=8). ***p<0.001 and **p<0.01 vs. secretion in the absence of forskolin.
(D) Effects of increasing concentrations of adrenaline (5 pM-5 μM) on glucagon secretion. Grey rectangles indicate glucagon secretion at 1 mM glucose alone (top) and 8 mM glucose (bottom). Experiments were performed in the presence of 1 mM glucose. Data have been normalized to control (4.9±0.34 pg/islet/h; n=4). ***p<0.001 and *p<0.05 vs. secretion in the absence of adrenaline.
(E) Confocal immunostaining of cells dispersed from single mouse islets. Cells were labelled with antibodies against glucagon (red) and PKA-RI (green). Rightmost panel shows the superimposed images (merge).
(F) As in E but using antibody against PKA-RII.
(G) Schematic illustration of image analysis. The ratio between near-plasma membrane and cytosolic immunoreactivity was determined using the equation inserted into the image.
(H) Ratio between near-plasma membrane and cytosolic immunoreactivity calculated as illustrated in G. ***p<0.001 (n=10 for PKA-RI and PKA-RII.

