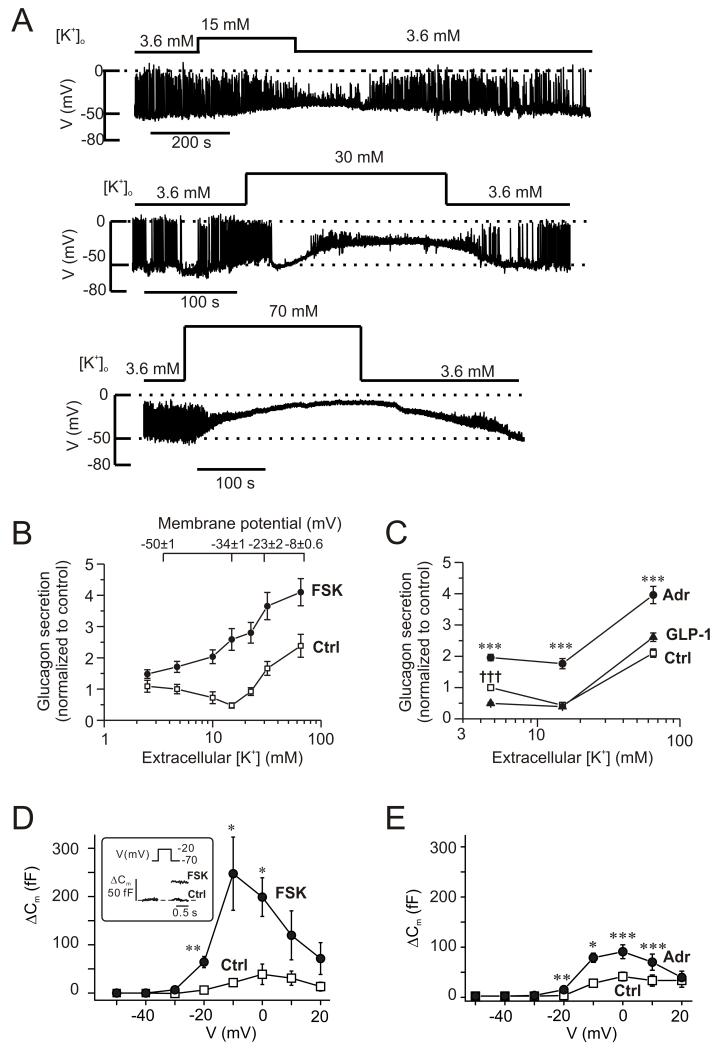
Figure 3.
Cyclic AMP-dependent modulation of the membrane potential dependence of glucagon secretion.
(A) Membrane potential recordings from α-cells within intact islets (spontaneously active at 1 mM glucose) at 3.6 mM, 15 mM, 30 mM and 70 mM extracellular K+ (as indicated).
(B) Glucagon secretion measured at extracellular K+ concentrations ([K+]o) between 2.5 and 65 mM under control conditions (□) and in the presence of 10 μM forskolin (●). Glucose was present at 1 mM. The membrane potentials indicated (top) were obtained from experiments of the type as shown in A (n=7, 4, 4, 3 at 3.6 mM, 15 mM, 30 mM and 70 mM). Secretion data have been normalized to control (34.4±4.5 pg/islet/h measured at 4.7 mM [K+]o; n=4-8). All values in the presence of forskolin are significantly different from corresponding control values (p<0.01 or better). Glucagon release under control conditions at 15 mM [K+]o is significantly (p<0.05) lower, while glucagon secretion at 32 and 65 mM [K+]o is significantly (p<0.001) higher than that at 4.7 mM [K+]o.
(C) Glucagon secretion measured at 4.7 mM, 15 mM and 65 mM [K+]o (control, □) and in the presence of 5 μM adrenaline (●) or 100 nM GLP-1 (▲). Glucose was present at 1 mM. Data have been normalized to glucagon secretion at 4.7 mM [K+]o (33.4±1.5 pg/islet/h; n=10). ***p<0.001 for adrenaline vs. control and †††p<0.001 for GLP-1 vs. control.
(D) Changes in membrane capacitance (ΔCm) displayed against membrane potential of depolarization (V) under control conditions (□) and 4 min after application of 10 μM forskolin (●). n=5 cells. *p<0.05; **p<0.01 vs. control. The inset shows the response to a depolarization to −20 mV.
(E) As in D but comparing responses in the presence of 5 μM adrenaline (●) with control responses (□). n=5 cells. *p<0.05; **p<0.01; ***p<0.001 vs. control.

