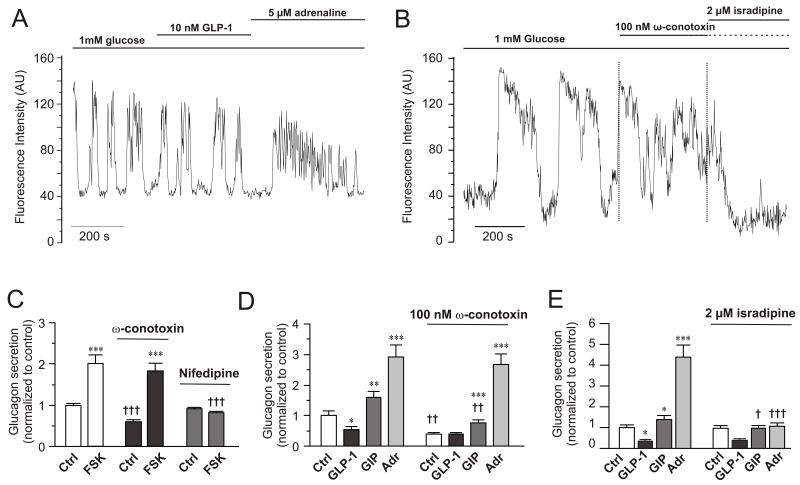
Figure 5.
Effects of GLP-1, adrenaline and Ca2+-channel blockers on α-cell [Ca2+]i and glucagon secretion
(A) Spontaneous [Ca2+]i-oscillations in individual α-cells in intact mouse islets exposed to 1 mM glucose and effects of including 10 nM GLP-1 or 5 μM adrenaline in the perfusion medium during the periods indicated by horizontal lines. n=12 cells in 4 islets from 3 mice.
(B) As in A but 100 nM ω-conotoxin and 2 μM isradipine were applied. n= 14 cells in 4 islets from 2 mice.
(C) Glucagon secretion at 1 mM glucose (Ctrl) and in the presence of 10 μM forskolin in the absence (left) and presence of 1 μM ω-conotoxin (middle) or 50 μM nifedipine (right). Data have been normalized to control in the absence of forskolin and the Ca2+-channel blockers (30.7±1.2 pg/islet/h; n=8-10). ***p<0.001 vs. respective control (Ctrl) in the absence or presence of ω-conotoxin or isradipine. †††p<0.001 vs. corresponding value in the absence of ω-conotoxin or isradipine.
(D) As in C but comparing the effects of 100 nM GLP-1, 100 nM GIP and 5 μM adrenaline (Adr) in the absence (left) and presence (right) of 100 nM ω-conotoxin. n=10. *p<0.05, **p<0.01 and ***p<0.001 vs. respective Ctrl in the absence or presence of ω-conotoxin; ††p<0.01 vs. corresponding value in the absence of ω-conotoxin.
(E) As in D but 2 μM isradipine was applied. n=7-10. *p<0.05 and ***p<0.001 vs. Ctrl; †p<0.001 vs. GIP in absence of isradipine and †††p<0.001 vs. adrenaline in absence of isradipine.

