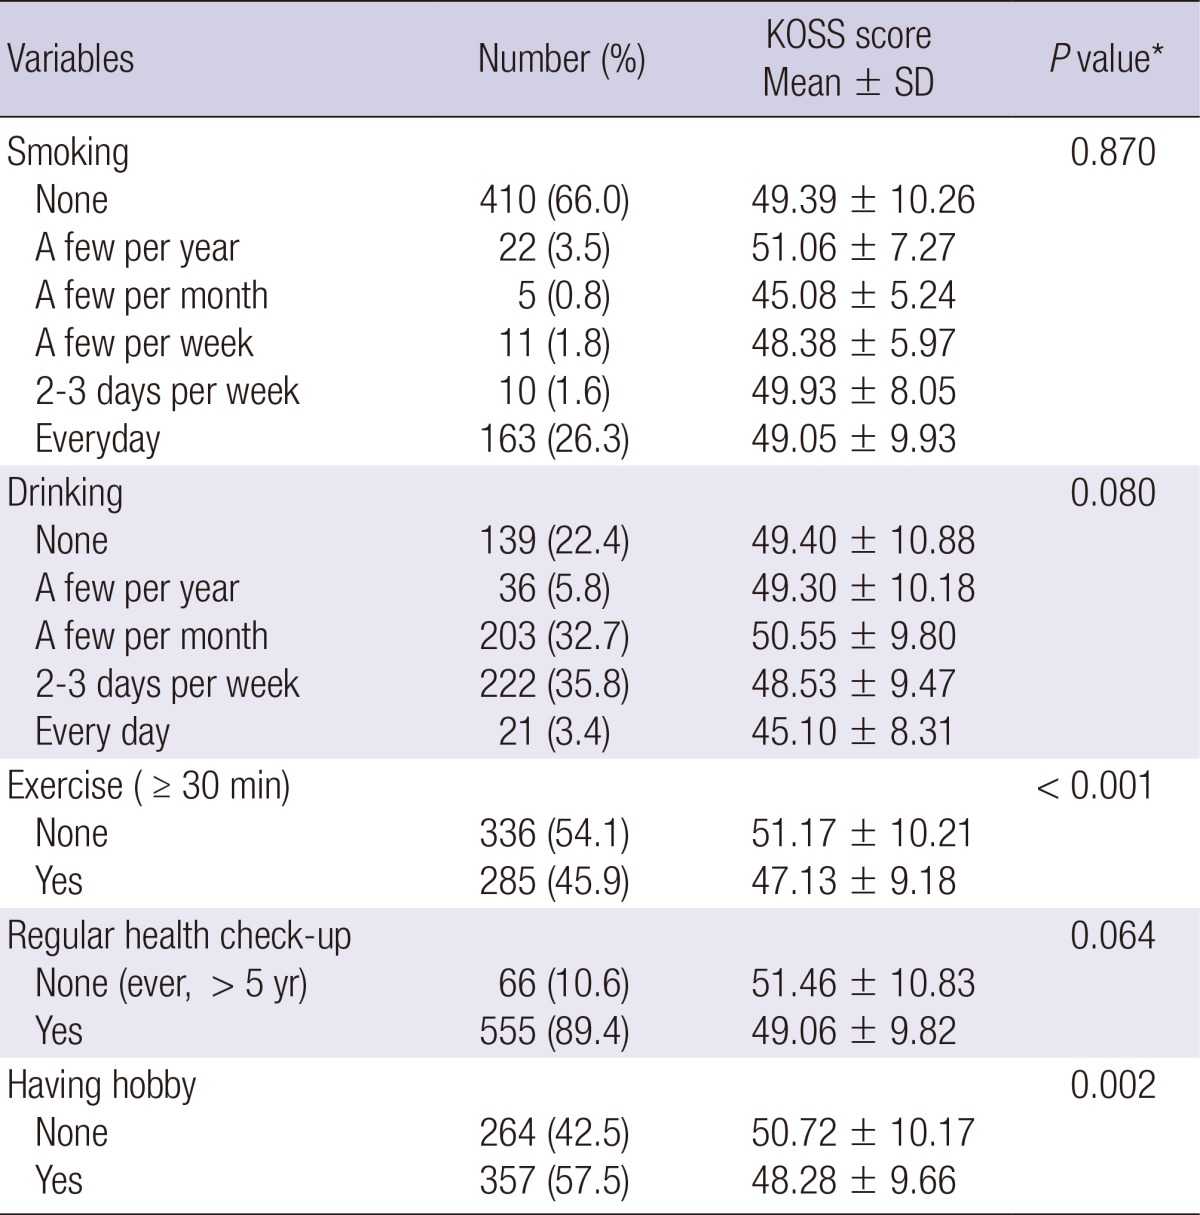
Table 2.
Life style variables of responding Korean surgeons

Values are mean ± SD or number of patients (%).
*P values by ANOVA or Student's t-test as appropriate.
Life style variables of responding Korean surgeons

Values are mean ± SD or number of patients (%).
*P values by ANOVA or Student's t-test as appropriate.