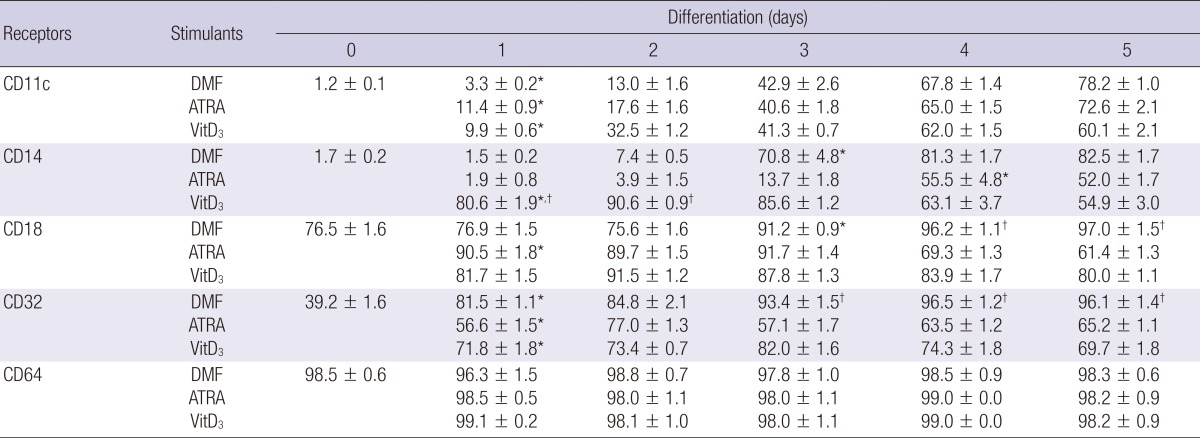
Table 1.
Phenotypic expression of immune receptors on the differentiated HL-60 cells

Numbers in the Table are the geometric mean±SD of fluorescence intensity. *P<0.05 (vs. Day 0); †P<0.05 (DMF vs. ATRA or VitD3).
Phenotypic expression of immune receptors on the differentiated HL-60 cells

Numbers in the Table are the geometric mean±SD of fluorescence intensity. *P<0.05 (vs. Day 0); †P<0.05 (DMF vs. ATRA or VitD3).