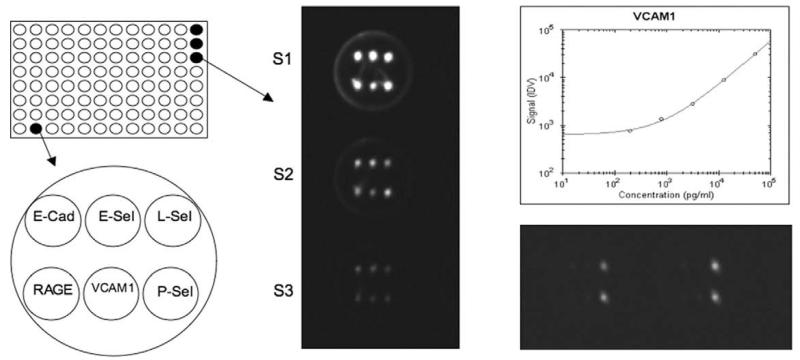
Fig. 2.
Analysis of cell adhesion molecules (CAMs) using Thermo Scientific SearchLight Protein Array Technology. A single well of a 96-well plate is spotted with different primary antibodies against different CAMs: E-cadherin (E-Cad), E-, L- and P-selectins (E-Sel, L-Sel and P-Sel), receptor for advanced glycosilation endproduct (RAGE) or vascular cell adhesion molecule-1 (VCAM-1). After processing of the wells the chemiluminescence is detected by a CCD camera: the spots in the wells S1-S3 correlate to standards of the respective CAMs, which are plotted as standard curves (e.g., for VCAM-1). The unknown biomarkers in the wells are calculated from the respective standard curves.

