
Figure 1.
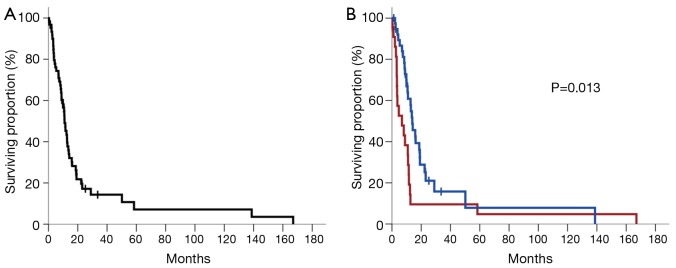
(A) Kaplan-Meier plot of survival for all patients included in the study (n=62); (B) Kaplan-Meier plot of survival stratified by whether patients received adjuvant therapy following tumor resection (blue curve) or not (red curve). Vertical tick marks represent censored patients. The P value is derived from univariate Cox regression analysis.