
Fig. 2.
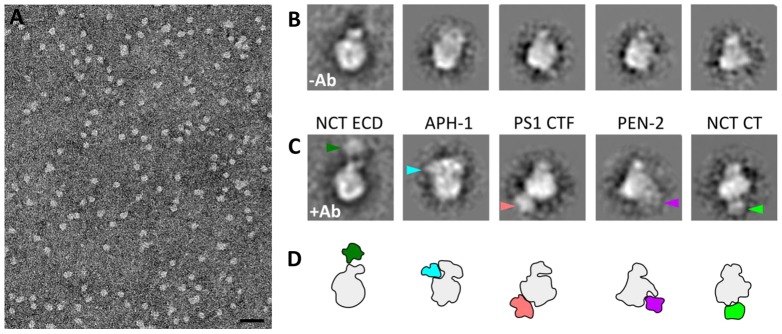
Electron microscopy characterization of purified γ-secretase complex. (A) Representative micrograph of the purified γ-secretase. Scale bar: 50 nm. (B,C) Class averages of free (B) and antibody-labeled (C) γ-secretase showing corresponding orientations. The extra density resulting from the bound antibody is indicated by an arrowhead for each of the different antibodies in C. The density of the anchored antibody is enhanced in class averages, whereas other domains of the antibody, which move independently, are averaged out. (D) Outlines of the densities shown in B, γ-secretase is in gray and the antibody densities are shown in color. Additional class averages are shown in supplementary material Fig. S1.