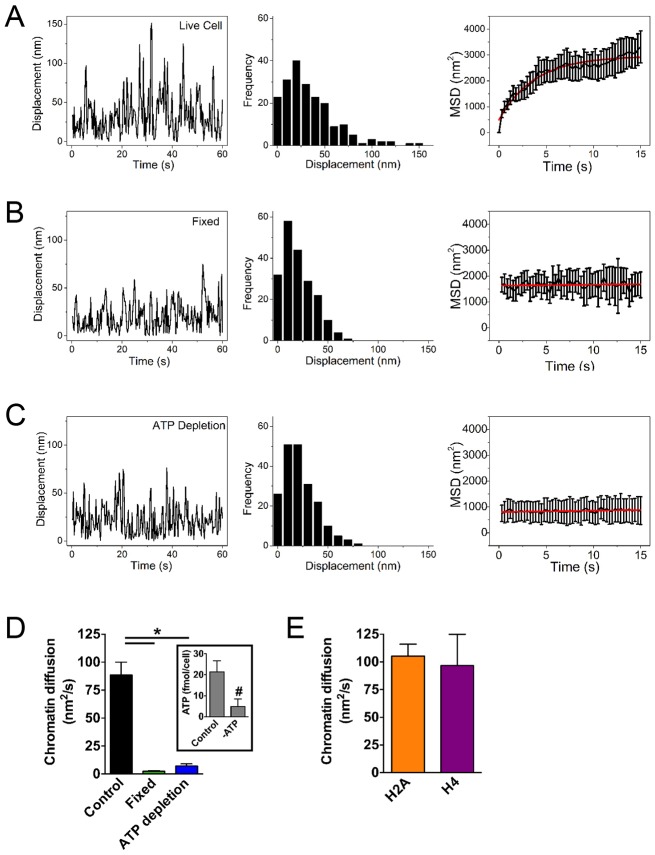
Fig. 2.
Cell fixation and ATP depletion reduce chromatin diffusion. PAGFP–H2A PPT in live untreated cells (A), in cells fixed with formaldehyde (B) or after ATP depletion (C). Representative traces of displacements are shown (left) with the corresponding frequency distribution plots (center). MSD traces (right) were used to calculate chromatin diffusion. MSD data in A–C show the mean±s.e.m. (D) Quantification of chromatin diffusion in untreated, fixed or ATP-depleted cells. Data show the mean±s.e.m (from 10–20 cells); *P<0.0001 (Tukey test). The inset shows ATP levels in control and ATP-depleted cells. Data show the mean±s.e.m. (three biological replicates analyzed in triplicate); #P<0.0001 (Student's t-test). (E) Chromatin diffusion calculated with cells expressing PAGFP–H2A or PAGFP–H4 (n≧10). Data show the mean±s.e.m.

