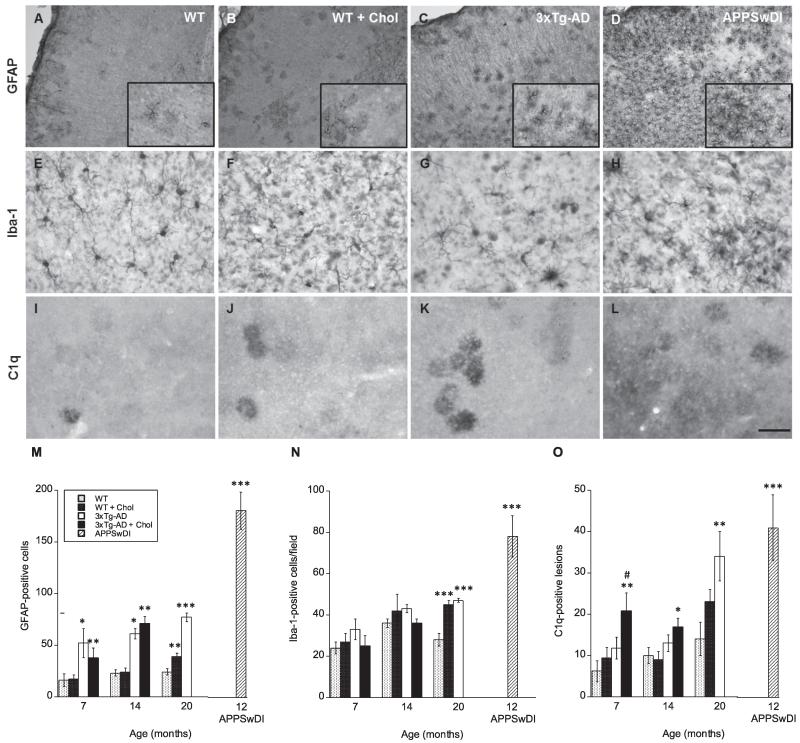
Fig. 3.
Effects of high cholesterol diet on neuroinflammation. Wildtype (WT) (A, E, I) and triple-transgenic AD (3xTg-AD; C, G, K) were fed a 5% cholesterol diet (B, F, J) for 7, 14, and 20 months. APPSwDI mice (12-month-old) were used as a positive control (D, H, L). At different time points, brains were collected, sectioned (40 μm), and stained for immune-related cells and components: astrocyte marker GFAP (A–D), microglia/macrophage marker Iba1 (E–H), and complement subcomponent C1q (I–L). Images shown were taken from animals at 20 months of age, except for APPSwDI animals (D, H, L), which were 12 months old. Quantitative analysis is shown for GFAP (M), Iba1 (N) and C1q (O). Different treatments (bar labeling) are explained in panel M. Three to four brain sections were evaluated per animal. Values represent mean number of cortical GFAP or Iba1-positive cells or C1q lesions ± SEM. Five animals were examined per group. Statistical analysis was performed using a one-way ANOVA and Fisher’s LSD posthoc test. Symbols indicate the significant difference between groups compared to WT (*p < 0.05, **p < 0.01, ***p < 0.001) or 3xTg-AD (#p < 0.05). Scale bar = 100 μm (E–L), 200 μm (A–D), and 140 μm (A–D insets).

