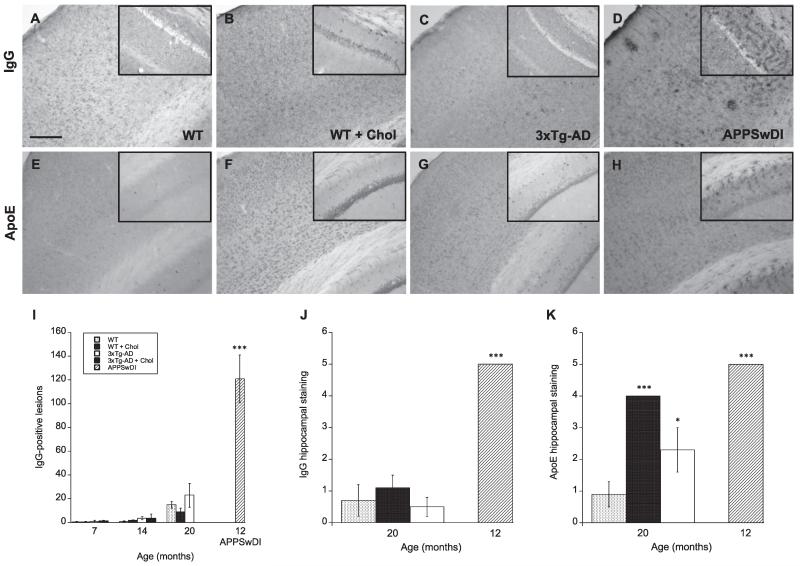
Fig. 4.
Plasma protein infiltration mice fed a high cholesterol diet. Wildtype (WT; A, B, E, F) and triple-transgenic AD (3xTg-AD; C & G) mice fed a 5% cholesterol diet (B & F) for 7, 14, and 20 months. APPSwDI mice (12-month-old) were used as a positive control (D & H). At different time points, blood–brain barrier disruption was evaluated by anti-mouse IgG staining (A-D) or apolipoprotein E (ApoE) immunoreactivity (E–H) in the cortex and hippocampus. Images shown were taken from animals at 20 months of age, unless otherwise indicated. Quantitative analysis is shown for anti-mouse IgG (I & J) or ApoE (K). Different treatments (bar labeling) are explained in panel I. Three to four brain sections were evaluated per animal. Values represent mean number of IgG lesions or IgG/ApoE semi-quantitative staining intensity ± SEM. Five animals were examined per group. Statistical analysis was performed using a one-way ANOVA and Fisher’s LSD posthoc test. Symbols indicate the significant difference between groups compared to WT (*p < 0.05, ***p < 0.001). Scale bar = 100 μm (A–H) and 150 μm (A–H insets).

