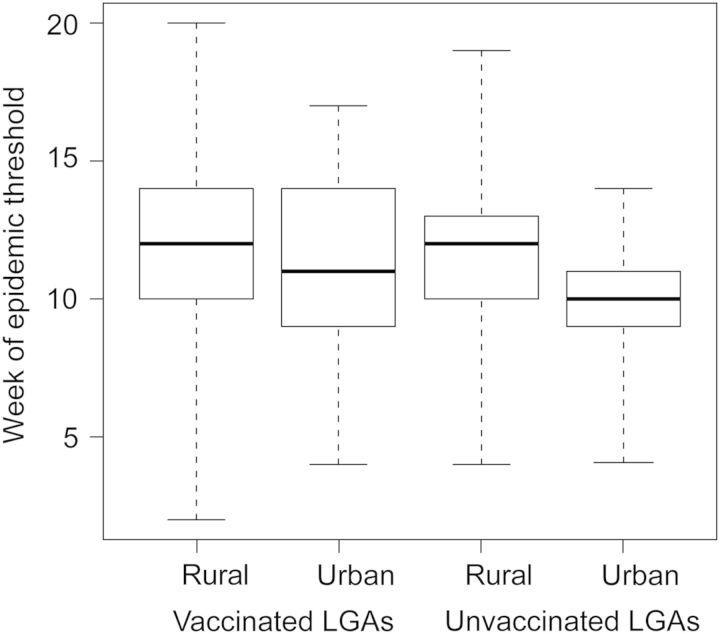
Figure 5.
Distribution of the timing of the meningitis epidemic threshold (10 cases per 100 000) in Katsina State, Nigeria, in 2009 at ward level. Box plots are grouped into urban and rural wards in local government areas (LGAs) that received polysaccharide vaccination (left) in 2009 and those that did not (right). Boxes indicate the median, 25th and 75th quantiles of the distribution of weeks; dashed lines extend to the earliest and latest week in each category.

