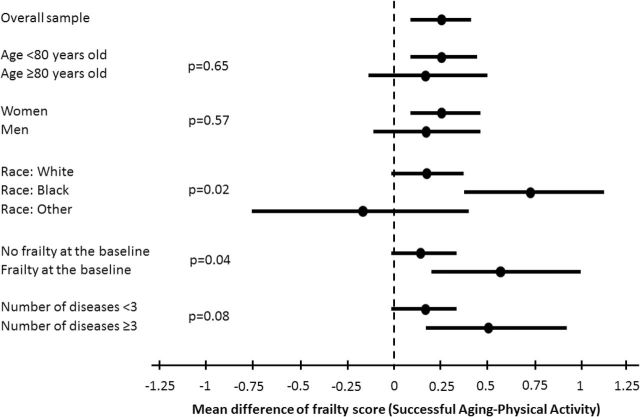
Figure 2.
Estimated effects of the intervention on the mean number of frailty criteria according to specific subgroups. Results are reported as means (95% CI). Estimates represent the average of the differences of mean levels between SA and PA groups over 6- and 12-mo visits obtained from a contrast estimated within a mixed effects model for the repeated frailty outcomes. Each model contained a prerandomization term representing the number of frailty conditions, an intervention effect, a visit effect, a term representing subgroup factor, and interactions between these last three terms. For the frailty subgroup analysis, the continuous baseline frailty outcome was dropped from the model. The reported p values for equality of difference between subgroups are obtained as a contrast from mixed effects model. CI = confidence interval; PA = physical activity; SA = successful aging.

