Figure 2.
Genome-Wide Analysis of the SPL7 Regulon.
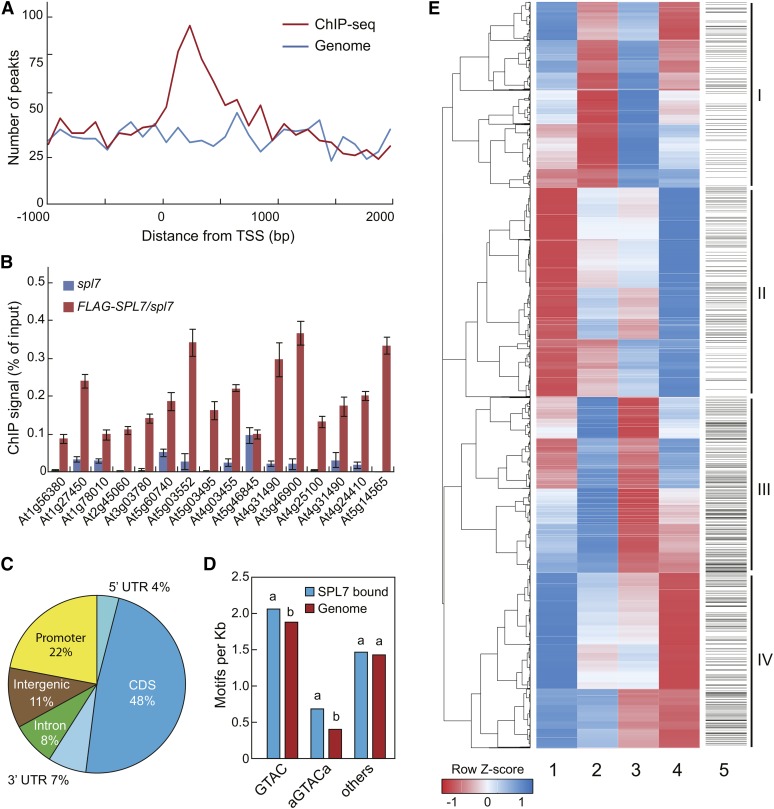
(A) Distribution of SPL7 binding peaks relative to the TSS. For genes with detected SPL7 binding, the regions 2000 bp downstream and 1000 bp upstream of the TSS were aligned and divided into 30 intervals. The number of genes with SPL7 binding (red) and the number of randomly selected genomic regions (blue) located in each interval were plotted.
(B) ChIP-qPCR validation of 16 randomly selected SPL7 binding sites. ChIP was performed in 35S:FLAG-SPL7/spl7 and spl7 seedlings with the anti-FLAG antibody. SPL7 binding profiles at these loci are depicted in Supplemental Figure 5. Values from quantitative PCR analysis were normalized to their respective DNA inputs. Data are means ± sd (n = 3).
(C) Distribution of SPL7 binding sites across annotated genomic regions. The percentages of binding sites located in the 5′ and 3′ untranslated region (UTR), coding region (CDS), promoter (1-kb region upstream of the TSS), and intergenic region are shown.
(D) Both the GTAC tetranucleotide and the AGTACA/TGTACT hexanucleotide, but none of other related hexanucleotides, are overrepresented in the SPL7 binding sites compared with random genome sequences. The same letters above the columns indicate no statistical difference, while different letters denote groups with significant differences (ANOVA, P < 0.01).
(E) Hierarchical clustering analysis of SPL7-regulated genes. The heat map was generated with differentially expressed genes from four pairwise comparisons: spl7/SC versus wild type/SC (column 1), wild type/DC versus wild type/SC (column 2), spl7/SC versus spl7/DC (column 3), and wild type/DC versus spl7/DC (column 4). Each row represents a gene whose scaled expression value, denoted as the row Z score, is plotted in a color scale with blue indicating higher expression and red indicating lower expression. Grouping of the four major clusters is indicated on the far right. The SPL7 binding pattern is shown as column 5, in which a horizontal line indicates SPL7 binding to a given gene.

