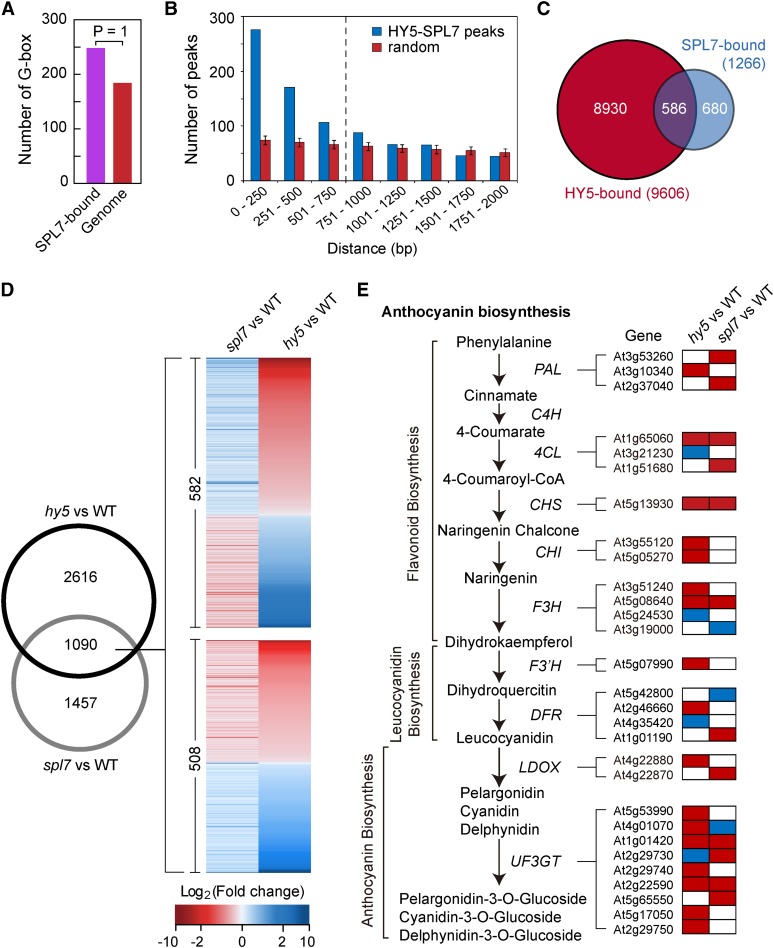
Figure 3.
SPL7 and HY5 Coregulate a Large Cohort of Genes.
(A) The G-box is significantly enriched in the SPL7 binding sites compared with random genomic sequences (posterior probability = 1).
(B) Clustering of SPL7 and HY5 binding sites defined by the global ChIP data. The distance between neighboring SPL7 and HY5 binding sites was calculated, and the number of sites as a function of distance in 250-bp intervals is plotted in blue. The control (red) summarizes 100× simulation of randomly selected genomic loci by the same analysis, with the error bars representing sd. The vertical dashed line indicates a cutoff distance (750 bp) below which SPL7 and HY5 binding sites show significant clustering based on a hypergeometric test (P < 0.001).
(C) Venn diagram showing the overlap of SPL7 and HY5 targeted genes. Using the cutoff illustrated in (B), 586 genes were considered bound by both SPL7 and HY5.
(D) The Venn diagram on the left shows the overlap of SPL7- and HY5-dependent genes under the DC/HL condition. Heat maps on the right illustrate expression changes of the 1090 genes in spl7 and hy5 compared with the wild type. Top, 582 genes influenced by SPL7 and HY5 in the opposite direction; bottom, 508 genes influenced in the same direction.
(E) Anthocyanin biosynthesis as a typical pathway coregulated by SPL7 and HY5. Biochemical steps leading to anthocyanin production are depicted on the left, with genes encoding the relevant enzymes listed. Boxes on the right represent differentially expressed genes in either spl7 or hy5 that are involved in the pathway. Relative expression levels of these genes in either spl7 or hy5 are shaded with different colors, with red indicating reduced expression, blue indicating increased expression, and white indicating no significant change in spl7 or hy5 compared with the wild type.

