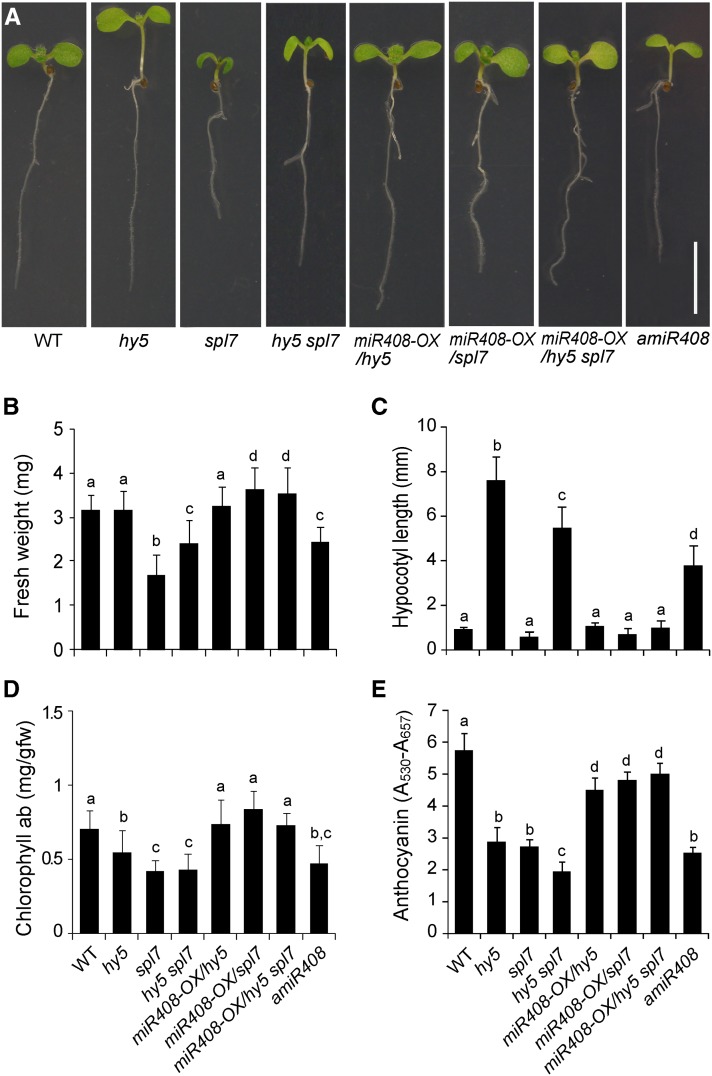
Figure 7.
Complementation of the hy5 and spl7 Mutations by MIR408 Overexpression.
(A) Seedling morphology of eight genotypes (as indicated) in which miR408 has varied expression levels. Seedlings were grown under the DC/HL condition and photographed 7 d after germination. Bar = 1 cm.
(B) to (E) Quantitative measurement of fresh weight (B), hypocotyl length (C), chlorophyll (D), and anthocyanin content (E) in seedlings of the eight genotypes. Genotypes labeled with the same letters have no statistical difference, while different letters denote groups with significant differences (ANOVA, P < 0.01). Data are means ± sd from n biological replicates, where n ≥ 30 for (B) and (C) and n = 3 for (D) and (E).
[See online article for color version of this figure.]

