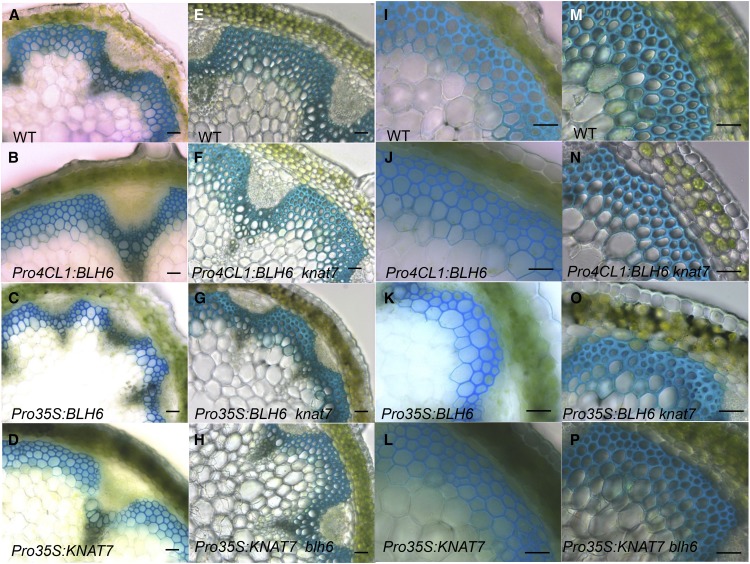
Figure 7.
Inflorescence Stem Secondary Cell Wall Phenotypes of BLH6 and KNAT7 Overexpression Lines in Wild-Type, knat7, and blh6 Mutant Backgrounds.
Stem cross sections were taken from the bases of the inflorescence stems of 6-week-old plants, stained with Toluidine blue, and examined for alterations in secondary wall thickness. Bars = 30 μm.
(A) to (D) Analysis of BLH6 and KNAT7 overexpression lines relative to wild-type control showing vascular bundles and interfascicular fibers.
(I) to (L) Analysis of BLH6 and KNAT7 overexpression lines relative to wild-type control showing interfascicular fiber region.
(A) and (I) Cross section from a wild-type control plant.
(B) and (J) Cross section from a Pro4CL1:BLH6 plant.
(C) and (K) Cross section from a Pro35S:BLH6 plant.
(D) and (L) Cross section from a Pro35S:KNAT7 plant.
(E) to (H) Analysis of Pro4CL1:BLH6 knat7, Pro35S:BLH6 knat7, and Pro35S:KNAT7 blh6 plants relative to the wild type showing vascular bundles and interfascicular fibers.
(M) to (P) Analysis of Pro4CL1:BLH6 knat7, Pro35S:BLH6 knat7, and Pro35S:KNAT7 blh6 plants relative to the wild type showing interfascicular fiber region.
(E) and (M) Cross section from a wild-type control plant.
(F) and (N) Cross section from a Pro4CL1:BLH6 knat7 plant.
(G) and (O) Cross section from a Pro35S:BLH6 knat7 plant.
(H) and (P) Cross section from a Pro35S:KNAT7 blh6 plant.

