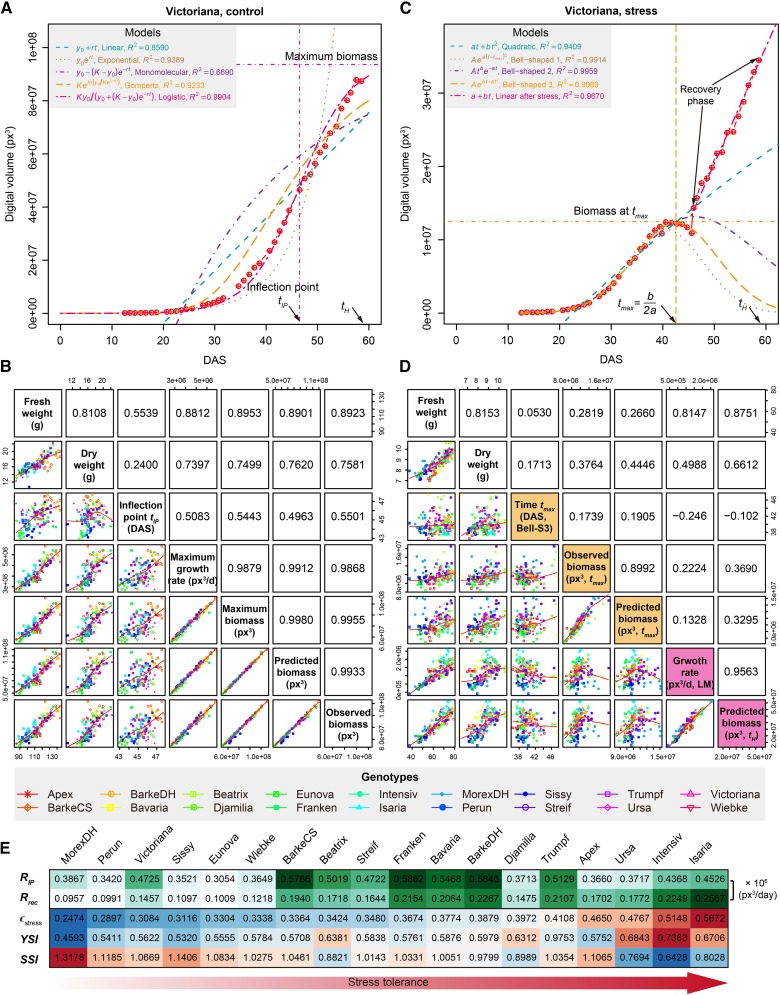
Figure 7.
Modeling of Plant Growth Based on Digital Biomass.
(A) Plant growth prediction based on fitting of the digital volume using five different mechanistic models. The quality of fit (R2) of each model is given. The best-fitted model-logistic model can be considered as the growth curve of barley plants. Several logistic-model derived parameters such as the “inflection point” (IP; a time point with the maximum growth rate) and “maximum biomass” (the maximum growth capacity) are indicated. Dots represent data points derived from images and curves represent the least-squares fit to the observed data. Shown is the result of fitting for a Victoriana plant. See also Supplemental Data Set 2.
(B) Pairwise comparison of model-derived parameters, image-derived data, and manually determined FW or DW for control plants. Each point in the dot plots (bottom-left quadrants) represents one plant from a specific genotype as colored and labeled at the bottom. Pearson’s correlation coefficients are indicated in top-right quadrants.
(C) Curve fitting of digital volume in drought stress conditions. Plant growth before rewatering is modeled by one quadratic function and three different bell-shaped functions. Growth in recovery phase is modeled by a linear function. Three vertical lines from left to right: the first inflection point, the time of maximum biomass, and the second inflection point estimated from the best-fitted model (bell-shaped model 3). See also Supplemental Data Set 3.
(D) Pairwise comparison of model-derived parameters, image-derived data, and manual measurements for stressed plants.
(E) Comparison of plant growth between control and stress conditions. RIP represents the growth rate (px3/day) at the inflection point of control plants. Rrec denotes the recovered growth rate (px3/day) in recovery phase of stress plants. ϵstress, referred to “stress elasticity” calculated as the ratio of Rrec and RIP. Two drought tolerance indexes, yield stability index (YSI) (Bouslama and Schapaugh, 1984) and stress susceptibility index (SSI) (Fischer and Maurer, 1978), are provided for comparison.

