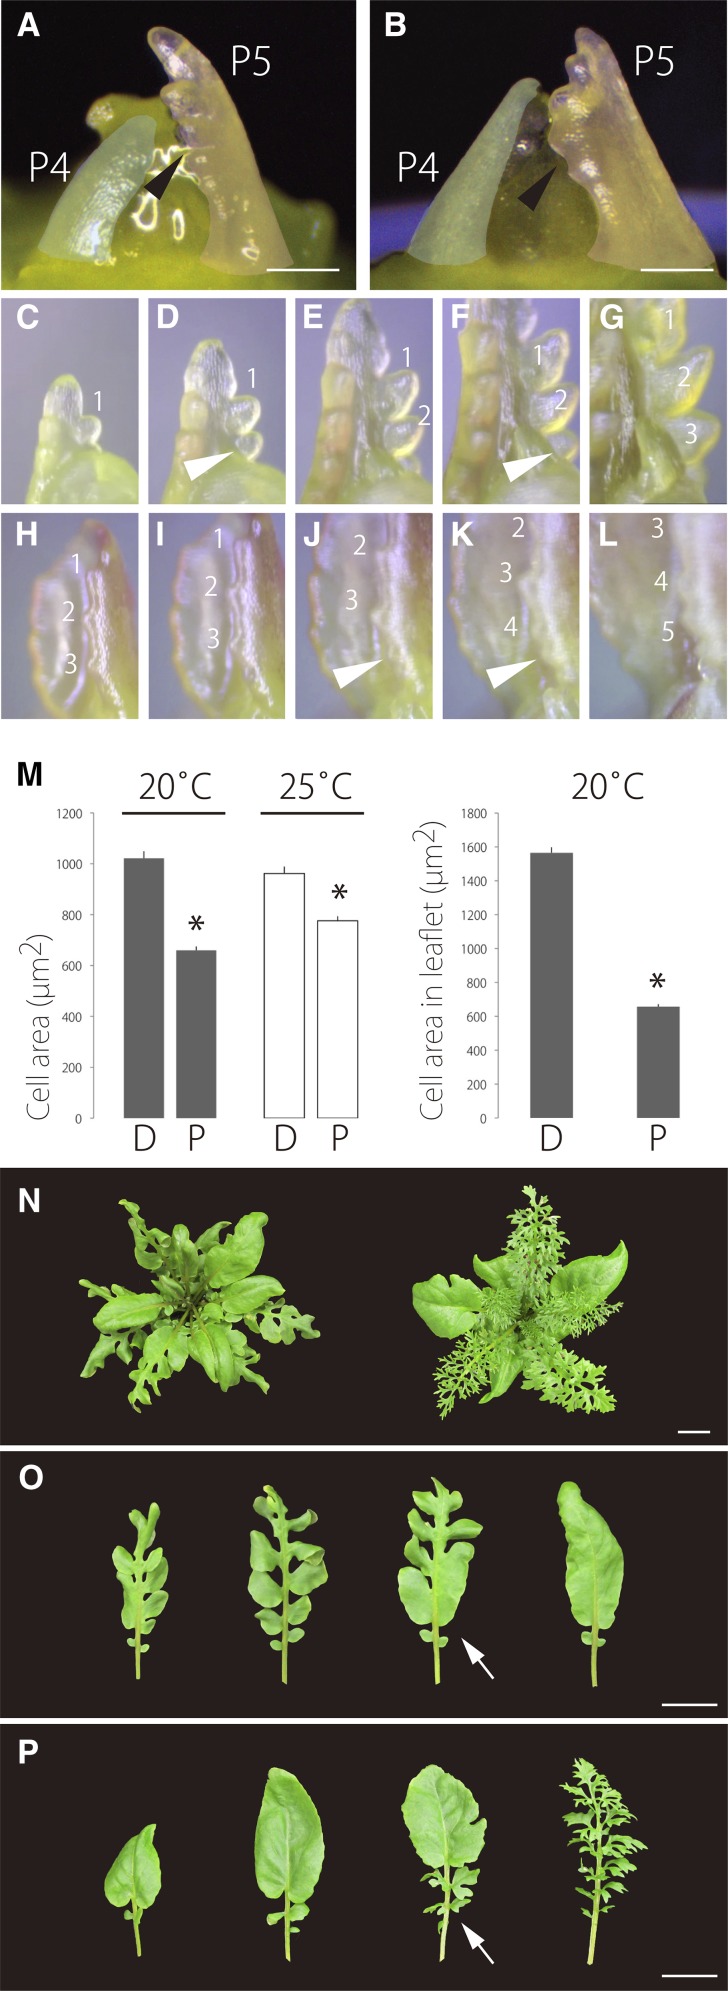
Figure 4.
Comparison of Leaf Development Dynamics.
(A) and (B) The shoot apex at 20°C (A) and at 25°C (B). P4 and P5 primordium are false-colored in blue and red, respectively. Black arrowheads indicate initiation of a leaflet or serration on a leaf primordium.
(C) to (G) Time-lapse analysis of leaflet initiation.
(H) to (L) Time-lapse analysis of serration initiation in simple leaves. White arrowheads indicate a newly emerged leaflet or serration.
(M) Comparison of cell area. Leaflets and leaves were counted at 20°C and 25°C, respectively. D, distal part of a leaf or a leaflet; P, proximal part of a leaf or a leaflet. The 7th leaves were used. Data are means ± sd (n = 6). *P < 0.01 (Student’s t test).
(N) to (P) Effect of temperature shift on leaf morphology.
(N) Top view of shoots. Left, shifted from 20°C to 25°C; right, shifted from 25°C to 20°C.
(O) Leaves from a plant shifted from 20°C to 25°C.
(P) Leaves from a plant shifted from 25°C to 20°C. Leaves are indicated in phyllotaxy order from left to right. White arrows indicate a leaf that displays intermediate morphology in response to temperature shifts.
Bars = 100 μm in (A) and (B) and 2 cm in (N) to (P).

