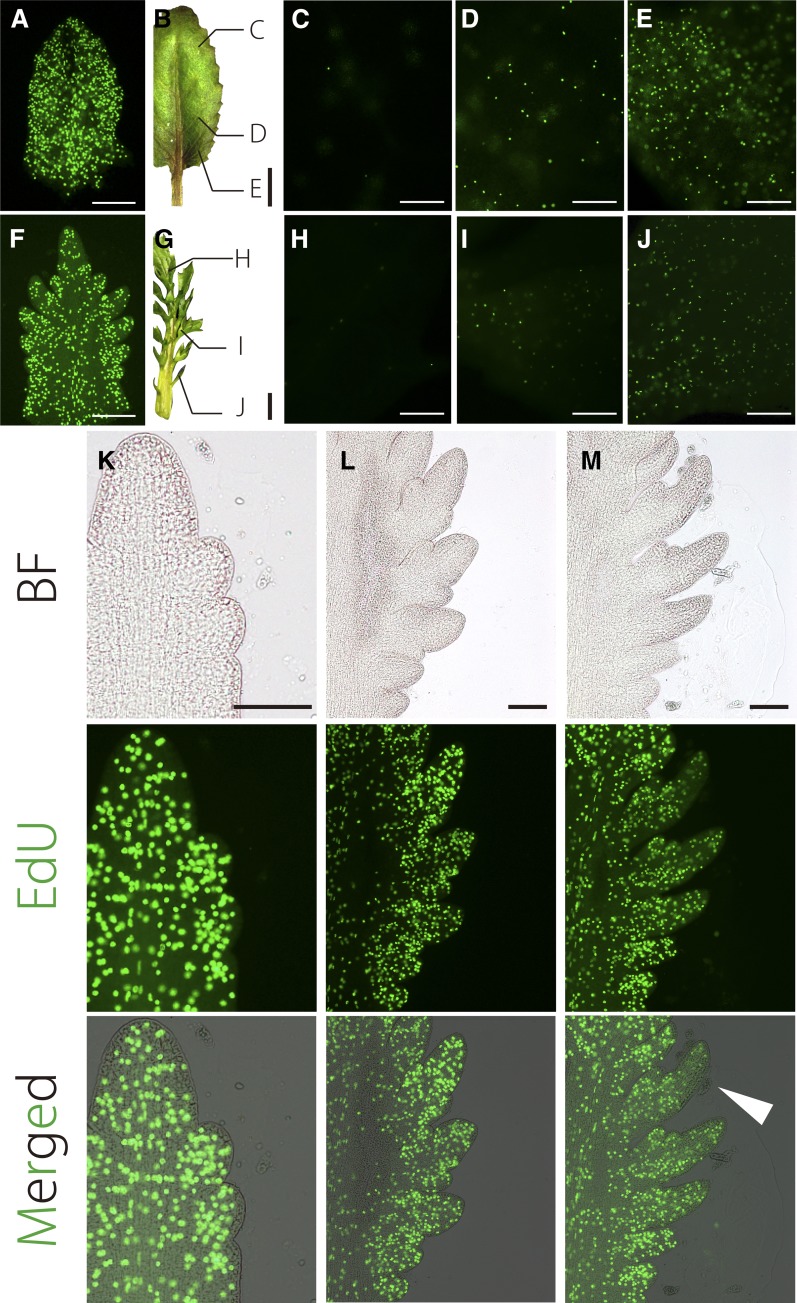
Figure 5.
EdU Visualization of Cell Proliferation in Leaves.
(A) Cell proliferation in ∼500-μm simple leaf primordia and leaves at 25°C.
(B) to (E) Cell proliferation in later stage leaves. The image in (B) illustrates leaf regions shown in (C) to (E). Cell proliferation in the distal region (C), middle region (D), and proximal region (E).
(F) Cell proliferation in ∼500-μm dissected leaf primordia and leaflets (at 20°C).
(G) to (J) Cell proliferation in dissected leaf primordia at a later stage. The image in (G) illustrates leaf regions shown in (H) to (J).
(K) to (M) Cell proliferation in leaflet primordia of increasing age. White arrowhead indicates a region showing decreased cell cycle activity. Top, bright field (BF); middle, EdU; bottom: merged. All leaves are 7th leaves.
Bars = 100 μm in (A), (C) to (F), and (H) to (M) and 1 mm in (B) and (G).

