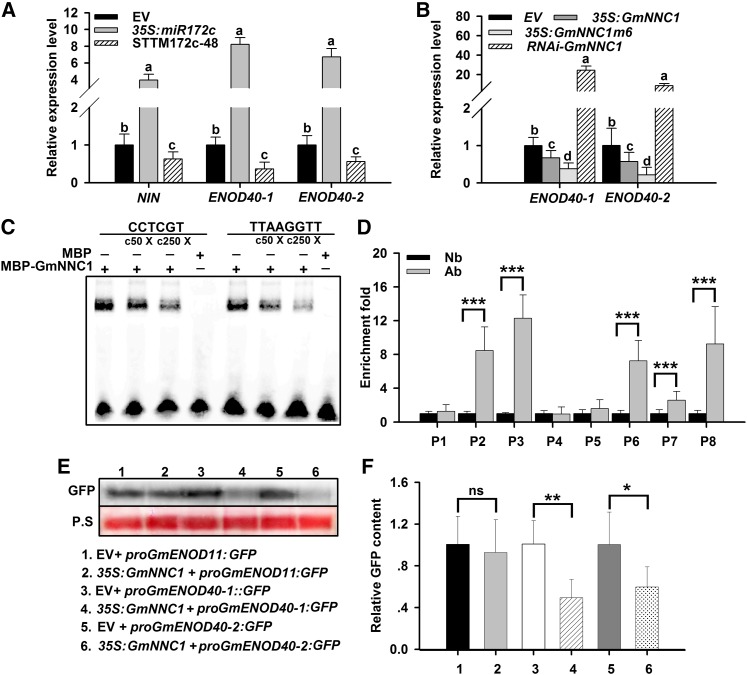
Figure 8.
NNC1 Directly Targets the Promoters of ENOD40 Genes.
(A) qRT-PCR analysis of NIN and ENOD40-1 and -2 in roots transformed with empty vector (EV), 35S:miR172c, or STTM172-48 at 28 DAI (n = 10 to 12). Transcript amounts in each sample were normalized to those of ELF1b. Expression levels shown are means ± se from three replicates. Different letters indicate a significant difference (Student-Newman-Kuels test, P < 0.05).
(B) qRT-PCR analysis of ENOD40 genes in roots transformed with empty vector, 35S:GmNNC1, 35S:GmNNC1m6, or RNAi-GmNNC1 at 28 DAI (n = 10 to 12). Transcript amounts in each sample were normalized to those of ELF1b. Expression levels are means ± se from three replicates. Different letters indicate a significant difference (Student-Newman-Kuels test, P < 0.05).
(C) EMSA showing that MBP-GmNNC1 binds to the CCTCGT and TTAAGGTT motifs of the ENOD40 promoters in vitro following incubation. Competition for binding was performed using 50× (c50×) and 250× (c250×) competitive ENOD40 probes; MBP was used as a negative control. Three biological replications were performed.
(D) ChIP assay for binding NNC1 to the ENOD40 promoters. The sequence regions marked by P1 to P8 indicate regions examined in the ChIP assays. ELF1b was employed as an internal control for expression. Three biological replications were performed. Each value is the average ± sd from three independent experiments. Asterisks represent statistically significant differences (Student’s t test, ***P < 0.001). Ab, antibody for fragment; Nb, no antibody for fragment.
(E) and (F) Repression of ENOD40 genes by NNC1. Constructs harboring proGmENOD40:GFP were transformed with 35S:GmNNC1 into N. benthamiana leaves. ENOD40 expression was analyzed by immunoblot (E), and GFP intensity was measured by fluorospectrophotometer (F). P.S, Ponceau S-stained gel representing equal loading. Nine independent plants were assessed. The experiment was repeated three times and always exhibited a similar trend. ENOD11 was used as a negative control. Each value is the average ± sd from three independent experiments. Asterisks represent statistically significant differences (Student’s t test, **P < 0.01, *P < 0.05; ns, not significant at P > 0.05).
[See online article for color version of this figure.]

